|
Download Data (XLS File) |
|
||||||||
|
||||||||
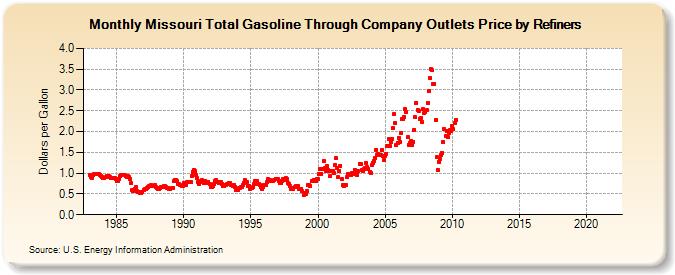
| Missouri Total Gasoline Through Company Outlets Price by Refiners (Dollars per Gallon) | ||||||||
| Year | Jan | Feb | Mar | Apr | May | Jun | Jul | Aug | Sep | Oct | Nov | Dec |
|---|---|---|---|---|---|---|---|---|---|---|---|---|
| 1983 | 0.944 | 0.905 | 0.880 | 0.945 | 0.975 | 0.976 | 0.981 | 0.976 | 0.972 | 0.960 | 0.932 | 0.907 |
| 1984 | 0.886 | 0.892 | 0.899 | 0.934 | 0.936 | 0.927 | 0.906 | 0.885 | 0.887 | 0.891 | 0.885 | 0.867 |
| 1985 | 0.820 | 0.801 | 0.858 | 0.931 | 0.947 | 0.957 | 0.966 | 0.961 | 0.937 | 0.903 | 0.922 | 0.917 |
| 1986 | 0.859 | 0.751 | 0.603 | 0.561 | 0.629 | 0.659 | 0.566 | 0.539 | 0.555 | 0.523 | 0.532 | 0.536 |
| 1987 | 0.595 | 0.614 | 0.619 | 0.643 | 0.657 | 0.682 | 0.696 | 0.713 | 0.699 | 0.700 | 0.704 | 0.663 |
| 1988 | 0.638 | 0.626 | 0.613 | 0.649 | 0.675 | 0.663 | 0.686 | 0.694 | 0.658 | 0.648 | 0.646 | 0.625 |
| 1989 | 0.622 | 0.640 | 0.646 | 0.802 | 0.843 | 0.827 | 0.803 | 0.729 | 0.734 | 0.720 | 0.701 | 0.683 |
| 1990 | 0.767 | 0.732 | 0.718 | 0.779 | 0.788 | 0.798 | 0.789 | 0.937 | 1.029 | 1.083 | 1.042 | 0.944 |
| 1991 | 0.875 | 0.783 | 0.744 | 0.813 | 0.828 | 0.781 | 0.761 | 0.818 | 0.766 | 0.754 | 0.788 | 0.736 |
| 1992 | 0.667 | 0.669 | 0.680 | 0.738 | 0.812 | 0.834 | 0.792 | 0.769 | 0.785 | 0.778 | 0.749 | 0.693 |
| 1993 | 0.692 | 0.710 | 0.715 | 0.743 | 0.770 | 0.767 | 0.717 | 0.707 | 0.696 | 0.710 | 0.667 | 0.594 |
| 1994 | 0.598 | 0.632 | 0.633 | 0.660 | 0.676 | 0.717 | 0.761 | 0.830 | 0.777 | 0.698 | 0.696 | 0.625 |
| 1995 | 0.648 | 0.638 | 0.669 | 0.748 | 0.802 | 0.809 | 0.739 | 0.727 | 0.718 | 0.655 | 0.629 | 0.655 |
| 1996 | 0.713 | 0.726 | 0.779 | 0.848 | 0.841 | 0.830 | 0.819 | 0.811 | 0.817 | 0.830 | 0.862 | 0.848 |
| 1997 | 0.854 | 0.804 | 0.762 | 0.771 | 0.818 | 0.863 | 0.824 | 0.877 | 0.851 | 0.756 | 0.748 | 0.689 |
| 1998 | 0.627 | 0.642 | 0.618 | 0.659 | 0.683 | 0.664 | 0.689 | 0.627 | 0.614 | 0.620 | 0.560 | 0.480 |
| 1999 | 0.516 | 0.507 | 0.569 | 0.707 | 0.716 | 0.696 | NA | 0.810 | 0.837 | 0.804 | 0.814 | 0.868 |
| 2000 | 0.857 | 0.980 | 1.099 | 0.988 | 1.101 | 1.295 | 1.125 | 1.047 | 1.161 | 1.086 | 1.054 | 0.935 |
| 2001 | 1.043 | 1.058 | 0.997 | 1.193 | 1.354 | 1.131 | 0.897 | 1.059 | 1.178 | 0.850 | 0.710 | 0.679 |
| 2002 | 0.721 | 0.724 | 0.899 | 0.979 | 0.972 | 0.966 | 0.997 | 0.988 | 0.977 | 1.079 | 0.979 | 0.965 |
| 2003 | 1.045 | 1.223 | 1.215 | 1.073 | 1.053 | 1.094 | 1.123 | 1.240 | 1.148 | 1.107 | 1.035 | 1.008 |
| 2004 | 1.188 | 1.244 | 1.299 | 1.355 | 1.567 | 1.445 | 1.458 | 1.443 | 1.441 | 1.562 | 1.423 | 1.320 |
| 2005 | 1.417 | 1.469 | 1.662 | 1.811 | 1.642 | 1.747 | 1.822 | 2.097 | 2.428 | 2.214 | 1.677 | 1.734 |
| 2006 | 1.840 | 1.753 | 1.973 | 2.301 | 2.306 | 2.348 | 2.532 | 2.466 | 1.862 | 1.688 | 1.724 | 1.782 |
| 2007 | 1.674 | 1.757 | 2.044 | 2.338 | 2.693 | 2.525 | 2.506 | 2.311 | 2.333 | 2.225 | 2.544 | 2.443 |
| 2008 | 2.476 | 2.510 | 2.698 | 2.981 | 3.291 | 3.502 | 3.480 | 3.135 | 3.155 | 2.289 | 1.381 | 1.087 |
| 2009 | 1.273 | 1.349 | 1.437 | 1.493 | 1.759 | 2.066 | 1.890 | 2.012 | 1.859 | 1.967 | 2.043 | 2.024 |
| 2010 | 2.130 | 2.055 | 2.198 | 2.283 | W | W | W | W | W | W | W | W |
| 2011 | W | W | W | W | W | W | W | W | W | - | - | - |
| 2012 | - | - | - | - | - | - | - | - | - | - | - | - |
| 2013 | - | - | - | - | - | - | - | - | - | - | - | - |
| 2014 | - | - | - | - | - | - | - | - | - | - | - | - |
| 2015 | - | - | - | - | - | - | - | - | - | - | - | - |
| 2016 | - | - | - | - | - | - | - | - | - | - | - | - |
| 2017 | - | - | - | - | - | - | - | - | - | - | - | - |
| 2018 | - | - | - | - | - | - | - | - | - | - | - | - |
| 2019 | - | - | - | - | - | - | - | - | - | - | - | - |
| 2020 | - | - | - | - | - | - | - | - | - | - | - | - |
| 2021 | - | - | - | - | - | - | - | - | - | - | - | - |
| 2022 | - | - | - | |||||||||
| - = No Data Reported; -- = Not Applicable; NA = Not Available; W = Withheld to avoid disclosure of individual company data. |
| Release Date: 6/1/2022 |
| Next Release Date: TBD |