|
Download Data (XLS File) |
|
||||||||
|
||||||||
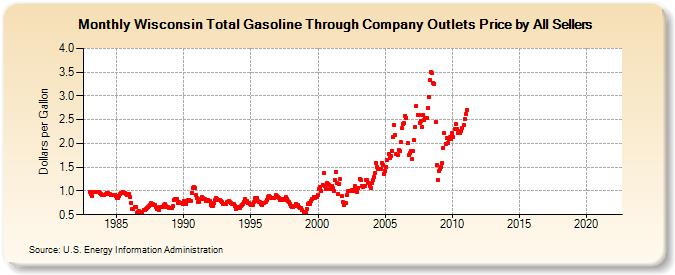
| Wisconsin Total Gasoline Through Company Outlets Price by All Sellers (Dollars per Gallon) | ||||||||
| Year | Jan | Feb | Mar | Apr | May | Jun | Jul | Aug | Sep | Oct | Nov | Dec |
|---|---|---|---|---|---|---|---|---|---|---|---|---|
| 1983 | 0.968 | 0.936 | 0.892 | 0.983 | 0.971 | 0.977 | 0.975 | 0.982 | 0.972 | 0.954 | 0.935 | 0.918 |
| 1984 | 0.923 | 0.918 | 0.935 | 0.949 | 0.953 | 0.945 | 0.929 | 0.914 | 0.920 | 0.922 | 0.917 | 0.896 |
| 1985 | 0.849 | 0.842 | 0.885 | 0.937 | 0.954 | 0.967 | 0.972 | 0.960 | 0.934 | 0.923 | 0.937 | 0.931 |
| 1986 | 0.883 | 0.755 | 0.619 | 0.615 | 0.660 | 0.665 | 0.544 | 0.565 | 0.571 | 0.549 | 0.551 | 0.551 |
| 1987 | 0.609 | 0.602 | 0.622 | 0.645 | 0.654 | 0.675 | 0.714 | 0.741 | 0.725 | 0.705 | 0.706 | 0.662 |
| 1988 | 0.622 | 0.622 | 0.603 | 0.664 | 0.669 | 0.664 | 0.708 | 0.728 | 0.677 | 0.654 | 0.667 | 0.636 |
| 1989 | 0.638 | 0.640 | 0.677 | 0.813 | 0.834 | 0.835 | 0.826 | 0.745 | 0.759 | 0.752 | 0.740 | 0.732 |
| 1990 | 0.792 | 0.756 | 0.728 | 0.787 | 0.807 | 0.814 | 0.783 | 0.966 | 1.057 | 1.090 | 1.060 | 0.913 |
| 1991 | 0.850 | 0.776 | 0.766 | 0.830 | 0.864 | 0.843 | 0.821 | 0.833 | 0.791 | 0.781 | 0.814 | 0.784 |
| 1992 | 0.705 | 0.676 | 0.693 | 0.752 | 0.815 | 0.849 | 0.831 | 0.813 | 0.818 | 0.796 | 0.774 | 0.732 |
| 1993 | 0.728 | 0.724 | 0.735 | 0.764 | 0.786 | 0.771 | 0.740 | 0.729 | 0.718 | 0.723 | 0.690 | 0.621 |
| 1994 | 0.635 | 0.669 | 0.646 | 0.682 | 0.708 | 0.735 | 0.769 | 0.822 | 0.785 | 0.752 | 0.744 | 0.724 |
| 1995 | 0.712 | 0.698 | 0.706 | 0.772 | 0.842 | 0.845 | 0.797 | 0.761 | 0.760 | 0.735 | 0.712 | 0.744 |
| 1996 | 0.755 | 0.762 | 0.810 | 0.875 | 0.899 | 0.880 | 0.859 | 0.844 | 0.849 | 0.852 | 0.905 | 0.896 |
| 1997 | 0.879 | 0.856 | 0.817 | 0.800 | 0.837 | 0.834 | 0.817 | 0.869 | 0.836 | 0.781 | 0.765 | 0.729 |
| 1998 | 0.678 | 0.670 | 0.653 | 0.684 | 0.721 | 0.708 | 0.695 | 0.653 | 0.639 | 0.639 | 0.591 | 0.533 |
| 1999 | 0.559 | 0.539 | 0.626 | 0.722 | 0.737 | 0.729 | 0.781 | 0.827 | 0.873 | 0.846 | 0.874 | 0.877 |
| 2000 | 0.923 | 1.040 | 1.085 | 0.993 | 1.133 | 1.369 | 1.097 | 1.036 | 1.165 | 1.143 | 1.134 | 1.033 |
| 2001 | 1.099 | 1.059 | 1.008 | 1.225 | 1.401 | 1.167 | 0.943 | 1.156 | 1.246 | 0.888 | 0.760 | 0.711 |
| 2002 | 0.739 | 0.736 | 0.908 | 0.991 | 1.000 | 0.995 | 1.019 | 1.009 | 1.021 | 1.105 | 1.010 | 0.979 |
| 2003 | 1.069 | 1.246 | 1.239 | 1.110 | 1.084 | 1.111 | 1.106 | 1.238 | 1.224 | 1.163 | 1.110 | 1.070 |
| 2004 | 1.173 | 1.234 | 1.291 | 1.376 | 1.584 | 1.504 | 1.461 | 1.461 | 1.454 | 1.594 | 1.541 | 1.365 |
| 2005 | 1.419 | 1.507 | 1.652 | 1.775 | 1.690 | 1.741 | 1.851 | 2.126 | 2.391 | 2.177 | 1.772 | 1.748 |
| 2006 | 1.867 | 1.832 | 2.021 | 2.320 | 2.408 | 2.438 | 2.583 | 2.536 | 2.010 | 1.751 | 1.797 | 1.833 |
| 2007 | 1.669 | 1.837 | 2.064 | 2.355 | 2.788 | 2.606 | 2.599 | 2.436 | 2.480 | 2.354 | 2.608 | 2.495 |
| 2008 | 2.537 | 2.536 | 2.738 | 2.986 | 3.341 | 3.500 | 3.489 | 3.275 | 3.257 | 2.450 | 1.548 | 1.239 |
| 2009 | 1.422 | 1.458 | 1.506 | 1.585 | 1.908 | 2.224 | 1.994 | 2.109 | 2.000 | 2.083 | 2.133 | 2.098 |
| 2010 | 2.218 | 2.131 | 2.309 | 2.401 | 2.311 | 2.225 | 2.239 | 2.221 | 2.266 | 2.331 | 2.380 | 2.505 |
| 2011 | 2.609 | 2.703 | - | - | - | - | - | - | - | - | - | - |
| 2012 | - | - | - | - | - | - | - | - | - | - | - | - |
| 2013 | - | - | - | - | - | - | - | - | - | - | - | - |
| 2014 | - | - | - | - | - | - | - | - | - | - | - | - |
| 2015 | - | - | - | - | - | - | - | - | - | - | - | - |
| 2016 | - | - | - | - | - | - | - | - | - | - | - | - |
| 2017 | - | - | - | - | - | - | - | - | - | - | - | - |
| 2018 | - | - | - | - | - | - | - | - | - | - | - | - |
| 2019 | - | - | - | - | - | - | - | - | - | - | - | - |
| 2020 | - | - | - | - | - | - | - | - | - | - | - | - |
| 2021 | - | - | - | - | - | - | - | - | - | - | - | - |
| 2022 | - | - | - | |||||||||
| - = No Data Reported; -- = Not Applicable; NA = Not Available; W = Withheld to avoid disclosure of individual company data. |
| Release Date: 6/1/2022 |
| Next Release Date: TBD |