|
Download Data (XLS File) |
|
||||||||
|
||||||||
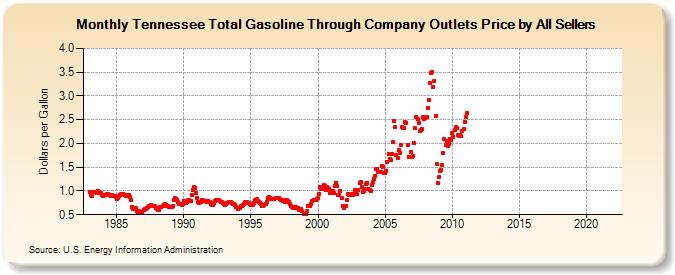
| Tennessee Total Gasoline Through Company Outlets Price by All Sellers (Dollars per Gallon) | ||||||||
| Year | Jan | Feb | Mar | Apr | May | Jun | Jul | Aug | Sep | Oct | Nov | Dec |
|---|---|---|---|---|---|---|---|---|---|---|---|---|
| 1983 | 0.985 | 0.916 | 0.897 | 0.970 | 0.975 | 0.979 | 0.964 | 1.001 | 0.979 | 0.966 | 0.948 | 0.920 |
| 1984 | 0.899 | 0.906 | 0.914 | 0.935 | 0.935 | 0.920 | 0.912 | 0.904 | 0.906 | 0.903 | 0.888 | 0.875 |
| 1985 | 0.829 | 0.845 | 0.891 | 0.915 | 0.936 | 0.932 | 0.935 | 0.921 | 0.893 | 0.894 | 0.913 | 0.907 |
| 1986 | 0.871 | 0.805 | 0.664 | 0.613 | 0.631 | 0.635 | 0.586 | 0.567 | 0.571 | 0.537 | 0.545 | 0.560 |
| 1987 | 0.599 | 0.622 | 0.626 | 0.645 | 0.663 | 0.678 | 0.692 | 0.704 | 0.689 | 0.686 | 0.675 | 0.642 |
| 1988 | 0.623 | 0.609 | 0.606 | 0.654 | 0.669 | 0.677 | 0.707 | 0.724 | 0.703 | 0.683 | 0.677 | 0.671 |
| 1989 | 0.663 | 0.662 | 0.680 | 0.813 | 0.847 | 0.838 | 0.814 | 0.761 | 0.732 | 0.724 | 0.710 | 0.718 |
| 1990 | 0.797 | 0.778 | 0.741 | 0.761 | 0.802 | 0.813 | 0.793 | 0.922 | 1.022 | 1.078 | 1.062 | 0.955 |
| 1991 | 0.855 | 0.773 | 0.744 | 0.763 | 0.805 | 0.802 | 0.783 | 0.799 | 0.796 | 0.778 | 0.783 | 0.767 |
| 1992 | 0.719 | 0.697 | 0.704 | 0.741 | 0.791 | 0.819 | 0.815 | 0.802 | 0.796 | 0.777 | 0.768 | 0.736 |
| 1993 | 0.716 | 0.708 | 0.722 | 0.747 | 0.770 | 0.775 | 0.758 | 0.743 | 0.731 | 0.726 | 0.700 | 0.652 |
| 1994 | 0.625 | 0.642 | 0.643 | 0.673 | 0.678 | 0.700 | 0.725 | 0.772 | 0.765 | 0.745 | 0.752 | 0.729 |
| 1995 | 0.707 | 0.706 | 0.696 | 0.755 | 0.819 | 0.822 | 0.790 | 0.759 | 0.742 | 0.718 | 0.686 | 0.685 |
| 1996 | 0.714 | 0.717 | 0.771 | 0.855 | 0.873 | 0.857 | 0.841 | 0.829 | 0.825 | 0.828 | 0.853 | 0.854 |
| 1997 | 0.857 | 0.850 | 0.828 | 0.818 | 0.803 | 0.787 | 0.775 | 0.818 | 0.816 | 0.786 | 0.758 | 0.725 |
| 1998 | 0.682 | 0.663 | 0.643 | 0.652 | 0.661 | 0.651 | 0.641 | 0.604 | 0.591 | 0.617 | 0.573 | 0.525 |
| 1999 | 0.524 | 0.516 | 0.582 | 0.693 | 0.692 | 0.683 | 0.725 | 0.782 | 0.819 | 0.817 | 0.815 | 0.834 |
| 2000 | 0.844 | 0.938 | 1.080 | 1.038 | 1.042 | 1.115 | 1.104 | 1.011 | 1.075 | 1.059 | 1.032 | 0.960 |
| 2001 | 0.998 | 1.004 | 0.962 | 1.111 | 1.177 | 1.105 | 0.917 | 0.915 | 1.005 | 0.844 | 0.691 | 0.640 |
| 2002 | 0.687 | 0.677 | 0.809 | 0.946 | 0.925 | 0.914 | 0.931 | 0.925 | 0.938 | 1.018 | 0.977 | 0.934 |
| 2003 | 1.015 | 1.166 | 1.192 | 1.086 | 0.984 | 1.004 | 1.038 | 1.139 | 1.157 | 1.050 | 1.012 | 1.009 |
| 2004 | 1.129 | 1.183 | 1.244 | 1.313 | 1.465 | 1.463 | 1.404 | 1.389 | 1.393 | 1.521 | 1.504 | 1.374 |
| 2005 | 1.375 | 1.429 | 1.601 | 1.776 | 1.663 | 1.657 | 1.777 | 2.030 | 2.475 | 2.342 | 1.749 | 1.698 |
| 2006 | 1.852 | 1.800 | 1.964 | 2.336 | 2.334 | 2.320 | 2.441 | 2.430 | 1.975 | 1.719 | 1.720 | 1.817 |
| 2007 | 1.706 | 1.729 | 2.015 | 2.317 | 2.555 | 2.504 | 2.433 | 2.252 | 2.288 | 2.299 | 2.565 | 2.504 |
| 2008 | 2.542 | 2.547 | 2.750 | 2.918 | 3.267 | 3.492 | 3.512 | 3.186 | 3.309 | 2.581 | 1.557 | 1.159 |
| 2009 | 1.288 | 1.420 | 1.451 | 1.538 | 1.791 | 2.087 | 1.971 | 2.055 | 1.945 | 1.991 | 2.100 | 2.079 |
| 2010 | 2.211 | 2.140 | 2.276 | 2.340 | 2.321 | 2.169 | 2.153 | 2.173 | 2.146 | 2.253 | 2.299 | 2.451 |
| 2011 | 2.556 | 2.647 | - | - | - | - | - | - | - | - | - | - |
| 2012 | - | - | - | - | - | - | - | - | - | - | - | - |
| 2013 | - | - | - | - | - | - | - | - | - | - | - | - |
| 2014 | - | - | - | - | - | - | - | - | - | - | - | - |
| 2015 | - | - | - | - | - | - | - | - | - | - | - | - |
| 2016 | - | - | - | - | - | - | - | - | - | - | - | - |
| 2017 | - | - | - | - | - | - | - | - | - | - | - | - |
| 2018 | - | - | - | - | - | - | - | - | - | - | - | - |
| 2019 | - | - | - | - | - | - | - | - | - | - | - | - |
| 2020 | - | - | - | - | - | - | - | - | - | - | - | - |
| 2021 | - | - | - | - | - | - | - | - | - | - | - | - |
| 2022 | - | - | - | |||||||||
| - = No Data Reported; -- = Not Applicable; NA = Not Available; W = Withheld to avoid disclosure of individual company data. |
| Release Date: 6/1/2022 |
| Next Release Date: TBD |