|
Download Data (XLS File) |
|
||||||||
|
||||||||
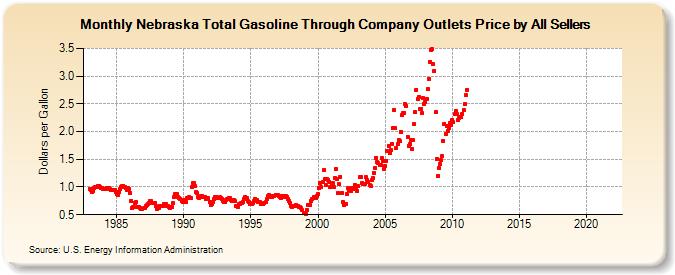
| Nebraska Total Gasoline Through Company Outlets Price by All Sellers (Dollars per Gallon) | ||||||||
| Year | Jan | Feb | Mar | Apr | May | Jun | Jul | Aug | Sep | Oct | Nov | Dec |
|---|---|---|---|---|---|---|---|---|---|---|---|---|
| 1983 | 0.971 | 0.942 | 0.916 | 0.931 | 0.981 | 1.002 | 1.004 | 1.020 | 1.024 | 1.000 | 0.981 | 0.981 |
| 1984 | 0.962 | 0.962 | 0.970 | 0.980 | 0.986 | 0.977 | 0.958 | 0.946 | 0.943 | 0.951 | 0.938 | 0.909 |
| 1985 | 0.865 | 0.860 | 0.912 | 0.963 | 0.998 | 1.019 | 1.021 | 1.001 | 0.978 | 0.954 | 0.974 | 0.969 |
| 1986 | 0.896 | 0.754 | 0.624 | 0.645 | 0.717 | 0.726 | 0.637 | 0.638 | 0.641 | 0.614 | 0.608 | 0.604 |
| 1987 | 0.622 | 0.628 | 0.653 | 0.674 | 0.693 | 0.713 | 0.741 | 0.744 | 0.717 | 0.706 | 0.709 | 0.660 |
| 1988 | 0.612 | 0.617 | 0.622 | 0.656 | 0.663 | 0.658 | 0.688 | 0.696 | 0.686 | 0.660 | 0.657 | 0.637 |
| 1989 | 0.629 | 0.640 | 0.703 | 0.823 | 0.868 | 0.872 | 0.868 | 0.813 | 0.796 | 0.785 | 0.747 | 0.725 |
| 1990 | 0.765 | 0.751 | 0.737 | 0.799 | 0.807 | 0.815 | 0.793 | 0.992 | 1.072 | 1.069 | 1.013 | 0.918 |
| 1991 | 0.889 | 0.816 | 0.799 | 0.830 | 0.846 | 0.815 | 0.811 | 0.823 | 0.776 | 0.777 | 0.798 | 0.737 |
| 1992 | 0.679 | 0.699 | 0.735 | 0.777 | 0.814 | 0.825 | 0.800 | 0.801 | 0.812 | 0.806 | 0.789 | 0.751 |
| 1993 | 0.735 | 0.734 | 0.768 | 0.790 | 0.803 | 0.796 | 0.762 | 0.751 | 0.750 | 0.764 | 0.742 | 0.662 |
| 1994 | 0.647 | 0.686 | 0.692 | 0.706 | 0.706 | 0.735 | 0.782 | 0.828 | 0.795 | 0.745 | 0.728 | 0.694 |
| 1995 | 0.693 | 0.698 | 0.708 | 0.753 | 0.789 | 0.770 | 0.734 | 0.726 | 0.723 | 0.701 | 0.693 | 0.699 |
| 1996 | 0.704 | 0.723 | 0.777 | 0.831 | 0.848 | 0.845 | 0.816 | 0.818 | 0.831 | 0.833 | 0.861 | 0.853 |
| 1997 | 0.849 | 0.829 | 0.825 | 0.798 | 0.830 | 0.841 | 0.820 | 0.844 | 0.827 | 0.784 | 0.754 | 0.713 |
| 1998 | 0.658 | 0.644 | 0.659 | 0.659 | 0.675 | 0.663 | 0.663 | 0.644 | 0.633 | 0.623 | 0.580 | 0.530 |
| 1999 | 0.525 | 0.516 | 0.592 | 0.678 | 0.683 | 0.683 | 0.744 | 0.790 | 0.818 | 0.804 | 0.803 | 0.829 |
| 2000 | 0.870 | 0.981 | 1.073 | 0.994 | 1.085 | 1.308 | 1.144 | 1.035 | 1.136 | 1.125 | 1.092 | 0.998 |
| 2001 | 1.045 | 1.075 | 1.003 | 1.162 | 1.328 | 1.137 | 0.894 | 1.050 | 1.186 | 0.888 | 0.726 | 0.671 |
| 2002 | 0.701 | 0.694 | 0.878 | 0.975 | 0.947 | 0.934 | 0.983 | 0.973 | 0.962 | 1.041 | 0.977 | 0.930 |
| 2003 | 1.012 | 1.172 | 1.187 | 1.072 | 1.045 | 1.046 | 1.063 | 1.172 | 1.123 | 1.093 | 1.038 | 1.014 |
| 2004 | 1.118 | 1.163 | 1.253 | 1.344 | 1.531 | 1.455 | 1.424 | 1.402 | 1.398 | 1.517 | 1.473 | 1.330 |
| 2005 | 1.381 | 1.470 | 1.647 | 1.739 | 1.606 | 1.669 | 1.783 | 2.067 | 2.387 | 2.062 | 1.705 | 1.769 |
| 2006 | 1.844 | 1.821 | 1.999 | 2.298 | 2.327 | 2.338 | 2.491 | 2.464 | 1.910 | 1.748 | 1.779 | 1.840 |
| 2007 | 1.686 | 1.847 | 2.129 | 2.350 | 2.758 | 2.584 | 2.629 | 2.405 | 2.414 | 2.327 | 2.605 | 2.500 |
| 2008 | 2.533 | 2.596 | 2.762 | 2.947 | 3.260 | 3.468 | 3.485 | 3.211 | 3.096 | 2.348 | 1.512 | 1.205 |
| 2009 | 1.347 | 1.409 | 1.485 | 1.553 | 1.836 | 2.144 | 1.952 | 2.097 | 2.012 | 2.059 | 2.152 | 2.120 |
| 2010 | 2.205 | 2.165 | 2.314 | 2.372 | 2.312 | 2.205 | 2.245 | 2.266 | 2.264 | 2.322 | 2.380 | 2.493 |
| 2011 | 2.653 | 2.754 | - | - | - | - | - | - | - | - | - | - |
| 2012 | - | - | - | - | - | - | - | - | - | - | - | - |
| 2013 | - | - | - | - | - | - | - | - | - | - | - | - |
| 2014 | - | - | - | - | - | - | - | - | - | - | - | - |
| 2015 | - | - | - | - | - | - | - | - | - | - | - | - |
| 2016 | - | - | - | - | - | - | - | - | - | - | - | - |
| 2017 | - | - | - | - | - | - | - | - | - | - | - | - |
| 2018 | - | - | - | - | - | - | - | - | - | - | - | - |
| 2019 | - | - | - | - | - | - | - | - | - | - | - | - |
| 2020 | - | - | - | - | - | - | - | - | - | - | - | - |
| 2021 | - | - | - | - | - | - | - | - | - | - | - | - |
| 2022 | - | - | - | |||||||||
| - = No Data Reported; -- = Not Applicable; NA = Not Available; W = Withheld to avoid disclosure of individual company data. |
| Release Date: 6/1/2022 |
| Next Release Date: TBD |