|
Download Data (XLS File) |
|
||||||||
|
||||||||
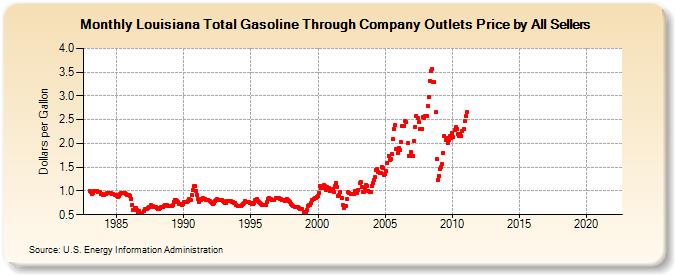
| Louisiana Total Gasoline Through Company Outlets Price by All Sellers (Dollars per Gallon) | ||||||||
| Year | Jan | Feb | Mar | Apr | May | Jun | Jul | Aug | Sep | Oct | Nov | Dec |
|---|---|---|---|---|---|---|---|---|---|---|---|---|
| 1983 | 1.002 | 0.972 | 0.942 | 0.960 | 0.999 | 0.997 | 0.994 | 0.977 | 0.976 | 0.975 | 0.940 | 0.939 |
| 1984 | 0.914 | 0.921 | 0.934 | 0.951 | 0.959 | 0.947 | 0.954 | 0.956 | 0.938 | 0.935 | 0.923 | 0.912 |
| 1985 | 0.888 | 0.871 | 0.888 | 0.929 | 0.953 | 0.963 | 0.957 | 0.953 | 0.926 | 0.923 | 0.921 | 0.920 |
| 1986 | 0.904 | 0.840 | 0.700 | 0.599 | 0.638 | 0.648 | 0.609 | 0.559 | 0.575 | 0.528 | 0.530 | 0.538 |
| 1987 | 0.575 | 0.616 | 0.617 | 0.626 | 0.642 | 0.658 | 0.669 | 0.695 | 0.674 | 0.672 | 0.669 | 0.655 |
| 1988 | 0.639 | 0.622 | 0.614 | 0.639 | 0.663 | 0.662 | 0.686 | 0.711 | 0.694 | 0.694 | 0.683 | 0.682 |
| 1989 | 0.679 | 0.674 | 0.696 | 0.769 | 0.820 | 0.814 | 0.797 | 0.765 | 0.723 | 0.721 | 0.705 | 0.716 |
| 1990 | 0.767 | 0.773 | 0.762 | 0.776 | 0.793 | 0.821 | 0.814 | 0.924 | 1.013 | 1.097 | 1.094 | 1.005 |
| 1991 | 0.905 | 0.830 | 0.775 | 0.800 | 0.841 | 0.843 | 0.828 | 0.836 | 0.820 | 0.810 | 0.808 | 0.794 |
| 1992 | 0.760 | 0.739 | 0.735 | 0.757 | 0.791 | 0.815 | 0.821 | 0.810 | 0.809 | 0.804 | 0.800 | 0.780 |
| 1993 | 0.758 | 0.747 | 0.753 | 0.784 | 0.793 | 0.789 | 0.780 | 0.771 | 0.767 | 0.754 | 0.738 | 0.709 |
| 1994 | 0.678 | 0.673 | 0.676 | 0.693 | 0.708 | 0.721 | 0.747 | 0.780 | 0.777 | 0.762 | 0.766 | 0.749 |
| 1995 | 0.737 | 0.725 | 0.719 | 0.753 | 0.813 | 0.828 | 0.796 | 0.764 | 0.747 | 0.727 | 0.706 | 0.701 |
| 1996 | 0.709 | 0.711 | 0.758 | 0.841 | 0.862 | 0.841 | 0.823 | 0.811 | 0.807 | 0.817 | 0.842 | 0.853 |
| 1997 | 0.852 | 0.847 | 0.833 | 0.828 | 0.814 | 0.808 | 0.794 | 0.820 | 0.823 | 0.807 | 0.791 | 0.764 |
| 1998 | 0.733 | 0.699 | 0.674 | 0.666 | 0.669 | 0.666 | 0.660 | 0.640 | 0.630 | 0.630 | 0.612 | 0.567 |
| 1999 | 0.555 | 0.553 | 0.591 | 0.690 | 0.708 | 0.706 | 0.745 | 0.801 | 0.834 | 0.853 | 0.859 | 0.883 |
| 2000 | 0.892 | 0.967 | 1.102 | 1.054 | 1.057 | 1.117 | 1.101 | 1.028 | 1.075 | 1.061 | 1.053 | 0.992 |
| 2001 | 1.025 | 1.036 | 0.981 | 1.100 | 1.167 | 1.074 | 0.903 | 0.909 | 0.974 | 0.845 | 0.714 | 0.651 |
| 2002 | 0.678 | 0.682 | 0.826 | 0.971 | 0.956 | 0.930 | 0.929 | 0.926 | 0.935 | 0.999 | 0.980 | 0.952 |
| 2003 | 1.022 | 1.172 | 1.195 | 1.084 | 0.974 | 0.988 | 1.035 | 1.128 | 1.109 | 1.009 | 0.981 | 0.987 |
| 2004 | 1.110 | 1.157 | 1.225 | 1.290 | 1.449 | 1.455 | 1.396 | 1.386 | 1.375 | 1.501 | 1.493 | 1.341 |
| 2005 | 1.349 | 1.410 | 1.583 | 1.739 | 1.646 | 1.665 | 1.783 | 2.088 | 2.309 | 2.379 | 1.891 | 1.801 |
| 2006 | 1.898 | 1.869 | 2.021 | 2.369 | 2.375 | 2.364 | 2.480 | 2.455 | 2.017 | 1.736 | 1.728 | 1.821 |
| 2007 | 1.739 | 1.726 | 2.051 | 2.351 | 2.579 | 2.531 | 2.451 | 2.314 | 2.309 | 2.309 | 2.548 | 2.533 |
| 2008 | 2.571 | 2.583 | 2.795 | 2.981 | 3.316 | 3.532 | 3.568 | 3.288 | 3.292 | 2.656 | 1.673 | 1.233 |
| 2009 | 1.322 | 1.457 | 1.505 | 1.576 | 1.804 | 2.159 | 2.077 | 2.110 | 2.004 | 2.063 | 2.158 | 2.121 |
| 2010 | 2.225 | 2.125 | 2.273 | 2.337 | 2.314 | 2.197 | 2.160 | 2.188 | 2.160 | 2.263 | 2.302 | 2.467 |
| 2011 | 2.567 | 2.662 | - | - | - | - | - | - | - | - | - | - |
| 2012 | - | - | - | - | - | - | - | - | - | - | - | - |
| 2013 | - | - | - | - | - | - | - | - | - | - | - | - |
| 2014 | - | - | - | - | - | - | - | - | - | - | - | - |
| 2015 | - | - | - | - | - | - | - | - | - | - | - | - |
| 2016 | - | - | - | - | - | - | - | - | - | - | - | - |
| 2017 | - | - | - | - | - | - | - | - | - | - | - | - |
| 2018 | - | - | - | - | - | - | - | - | - | - | - | - |
| 2019 | - | - | - | - | - | - | - | - | - | - | - | - |
| 2020 | - | - | - | - | - | - | - | - | - | - | - | - |
| 2021 | - | - | - | - | - | - | - | - | - | - | - | - |
| 2022 | - | - | - | |||||||||
| - = No Data Reported; -- = Not Applicable; NA = Not Available; W = Withheld to avoid disclosure of individual company data. |
| Release Date: 6/1/2022 |
| Next Release Date: TBD |