|
Download Data (XLS File) |
|
||||||||
|
||||||||
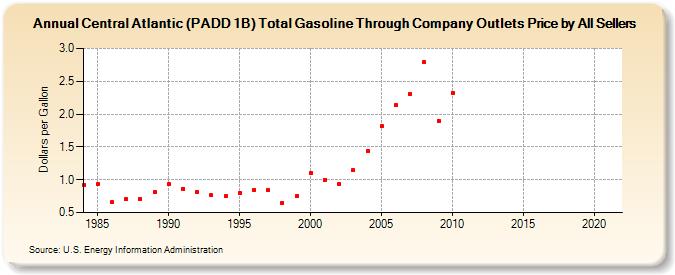
| Central Atlantic (PADD 1B) Total Gasoline Through Company Outlets Price by All Sellers (Dollars per Gallon) | ||||||||
| Decade | Year-0 | Year-1 | Year-2 | Year-3 | Year-4 | Year-5 | Year-6 | Year-7 | Year-8 | Year-9 |
|---|---|---|---|---|---|---|---|---|---|---|
| 1980's | 0.916 | 0.934 | 0.658 | 0.701 | 0.710 | 0.806 | ||||
| 1990's | 0.931 | 0.865 | 0.814 | 0.761 | 0.747 | 0.797 | 0.851 | 0.837 | 0.652 | 0.747 |
| 2000's | 1.097 | 1.002 | 0.930 | 1.141 | 1.433 | 1.814 | 2.134 | 2.310 | 2.787 | 1.900 |
| 2010's | 2.328 | - | - | - | - | - | - | - | - | - |
| 2020's | - |
| - = No Data Reported; -- = Not Applicable; NA = Not Available; W = Withheld to avoid disclosure of individual company data. |
| Release Date: 6/1/2022 |
| Next Release Date: TBD |