|
Download Data (XLS File) |
|
||||||||
|
||||||||
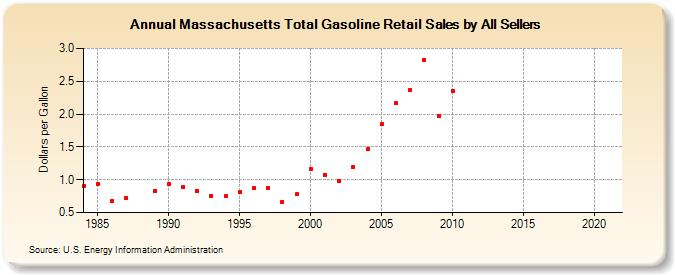
| Massachusetts Total Gasoline Retail Sales by All Sellers (Dollars per Gallon) | ||||||||
| Decade | Year-0 | Year-1 | Year-2 | Year-3 | Year-4 | Year-5 | Year-6 | Year-7 | Year-8 | Year-9 |
|---|---|---|---|---|---|---|---|---|---|---|
| 1980's | 0.912 | 0.939 | 0.673 | 0.728 | 0.827 | |||||
| 1990's | 0.928 | 0.886 | 0.828 | 0.757 | 0.745 | 0.814 | 0.869 | 0.870 | 0.668 | 0.778 |
| 2000's | 1.163 | 1.079 | 0.986 | 1.192 | 1.462 | 1.847 | 2.163 | 2.366 | 2.820 | 1.969 |
| 2010's | 2.358 | - | - | - | - | - | - | - | - | - |
| 2020's | - |
| - = No Data Reported; -- = Not Applicable; NA = Not Available; W = Withheld to avoid disclosure of individual company data. |
| Release Date: 6/1/2022 |
| Next Release Date: TBD |