|
Download Data (XLS File) |
|
||||||||
|
||||||||
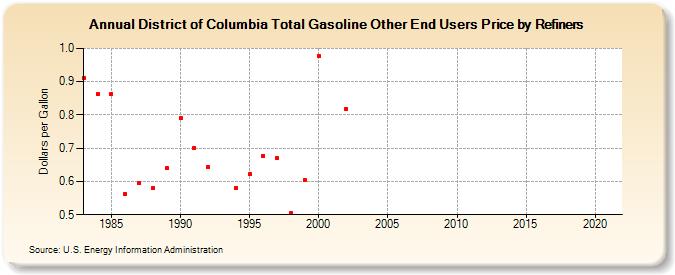
| District of Columbia Total Gasoline Other End Users Price by Refiners (Dollars per Gallon) | ||||||||
| Decade | Year-0 | Year-1 | Year-2 | Year-3 | Year-4 | Year-5 | Year-6 | Year-7 | Year-8 | Year-9 |
|---|---|---|---|---|---|---|---|---|---|---|
| 1980's | 0.912 | 0.863 | 0.863 | 0.562 | 0.595 | 0.580 | 0.640 | |||
| 1990's | 0.790 | 0.702 | 0.643 | W | 0.580 | 0.621 | 0.678 | 0.669 | 0.506 | 0.605 |
| 2000's | 0.978 | W | 0.818 | W | W | W | W | W | W | W |
| 2010's | W | W | W | W | - | - | - | - | - | - |
| 2020's | - |
| - = No Data Reported; -- = Not Applicable; NA = Not Available; W = Withheld to avoid disclosure of individual company data. |
| Release Date: 6/1/2022 |
| Next Release Date: TBD |