|
Download Data (XLS File) |
|
||||||||
|
||||||||
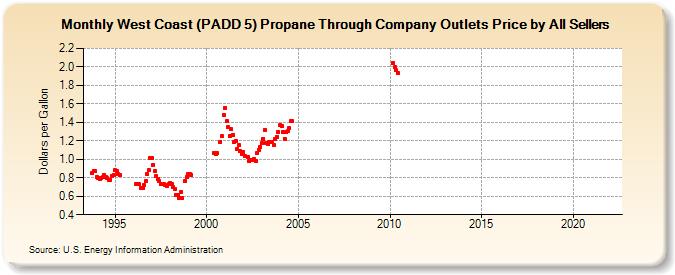
| West Coast (PADD 5) Propane Through Company Outlets Price by All Sellers (Dollars per Gallon) | ||||||||
| Year | Jan | Feb | Mar | Apr | May | Jun | Jul | Aug | Sep | Oct | Nov | Dec |
|---|---|---|---|---|---|---|---|---|---|---|---|---|
| 1993 | 0.854 | 0.875 | 0.870 | |||||||||
| 1994 | 0.807 | 0.799 | 0.783 | 0.799 | 0.805 | 0.830 | 0.813 | 0.795 | 0.774 | 0.779 | 0.824 | 0.831 |
| 1995 | 0.879 | 0.877 | 0.840 | 0.826 | W | W | W | W | W | W | W | W |
| 1996 | W | W | 0.735 | 0.733 | 0.728 | 0.692 | 0.684 | 0.724 | 0.761 | 0.840 | 0.881 | 1.015 |
| 1997 | 1.015 | 0.937 | 0.873 | 0.814 | 0.785 | 0.764 | 0.732 | 0.733 | 0.729 | 0.722 | 0.710 | 0.731 |
| 1998 | 0.744 | 0.735 | 0.698 | 0.675 | 0.614 | 0.616 | 0.581 | 0.645 | 0.583 | NA | 0.762 | 0.810 |
| 1999 | 0.839 | 0.836 | 0.833 | W | W | W | W | W | W | W | W | W |
| 2000 | W | W | W | W | W | 1.068 | 1.056 | 1.063 | W | 1.186 | 1.247 | 1.479 |
| 2001 | 1.555 | 1.409 | 1.344 | 1.252 | 1.324 | 1.266 | 1.188 | 1.203 | 1.110 | 1.152 | 1.089 | 1.057 |
| 2002 | 1.079 | 1.031 | W | 1.026 | 0.980 | 0.988 | 0.994 | 1.008 | 0.982 | 1.070 | 1.096 | 1.133 |
| 2003 | 1.172 | 1.224 | 1.317 | 1.174 | 1.167 | 1.192 | 1.184 | 1.182 | 1.156 | 1.219 | 1.246 | 1.297 |
| 2004 | 1.367 | 1.356 | 1.295 | 1.224 | 1.292 | 1.305 | 1.334 | 1.414 | 1.410 | W | W | W |
| 2005 | W | W | W | W | W | W | W | W | W | W | W | W |
| 2006 | W | W | W | W | W | W | W | W | W | W | W | W |
| 2007 | W | W | W | W | W | W | W | W | W | W | W | W |
| 2008 | W | W | W | W | W | W | W | W | W | W | W | W |
| 2009 | W | W | W | W | W | W | W | W | W | W | W | W |
| 2010 | W | W | 2.046 | 1.997 | 1.963 | 1.935 | W | W | W | W | W | W |
| 2011 | W | W | - | - | - | - | - | - | - | - | - | - |
| 2012 | - | - | - | - | - | - | - | - | - | - | - | - |
| 2013 | - | - | - | - | - | - | - | - | - | - | - | - |
| 2014 | - | - | - | - | - | - | - | - | - | - | - | - |
| 2015 | - | - | - | - | - | - | - | - | - | - | - | - |
| 2016 | - | - | - | - | - | - | - | - | - | - | - | - |
| 2017 | - | - | - | - | - | - | - | - | - | - | - | - |
| 2018 | - | - | - | - | - | - | - | - | - | - | - | - |
| 2019 | - | - | - | - | - | - | - | - | - | - | - | |
| 2020 | - | - | - | - | - | - | - | - | - | - | - | - |
| 2021 | - | - | - | - | - | - | - | - | - | - | - | - |
| 2022 | - | - | - | |||||||||
| - = No Data Reported; -- = Not Applicable; NA = Not Available; W = Withheld to avoid disclosure of individual company data. |
| Release Date: 6/1/2022 |
| Next Release Date: TBD |