|
Download Data (XLS File) |
|
||||||||
|
||||||||
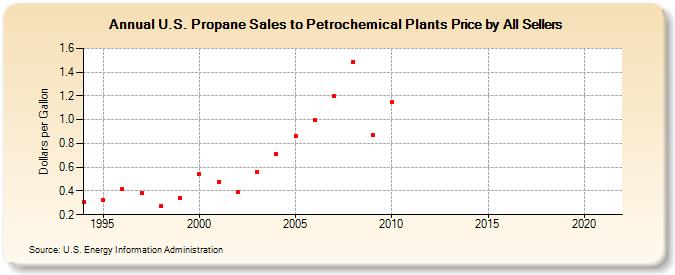
| U.S. Propane Sales to Petrochemical Plants Price by All Sellers (Dollars per Gallon) | ||||||||
| Decade | Year-0 | Year-1 | Year-2 | Year-3 | Year-4 | Year-5 | Year-6 | Year-7 | Year-8 | Year-9 |
|---|---|---|---|---|---|---|---|---|---|---|
| 1990's | 0.311 | 0.324 | 0.413 | 0.384 | 0.270 | 0.341 | ||||
| 2000's | 0.541 | 0.478 | 0.393 | 0.559 | 0.714 | 0.859 | 0.995 | 1.197 | 1.488 | 0.875 |
| 2010's | 1.146 | - | - | - | - | - | - | - | - | - |
| 2020's | - |
| - = No Data Reported; -- = Not Applicable; NA = Not Available; W = Withheld to avoid disclosure of individual company data. |
| Release Date: 6/1/2022 |
| Next Release Date: TBD |