|
Download Data (XLS File) |
|
||||||||
|
||||||||
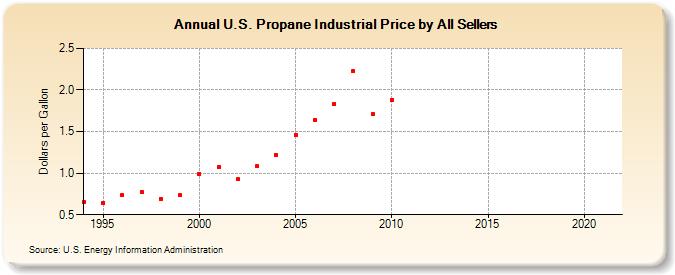
| U.S. Propane Industrial Price by All Sellers (Dollars per Gallon) | ||||||||
| Decade | Year-0 | Year-1 | Year-2 | Year-3 | Year-4 | Year-5 | Year-6 | Year-7 | Year-8 | Year-9 |
|---|---|---|---|---|---|---|---|---|---|---|
| 1990's | 0.652 | 0.646 | 0.733 | 0.778 | 0.692 | 0.734 | ||||
| 2000's | 0.990 | 1.074 | 0.924 | 1.081 | 1.224 | 1.461 | 1.643 | 1.837 | 2.223 | 1.706 |
| 2010's | 1.880 | - | - | - | - | - | - | - | - | - |
| 2020's | - |
| - = No Data Reported; -- = Not Applicable; NA = Not Available; W = Withheld to avoid disclosure of individual company data. |
| Release Date: 6/1/2022 |
| Next Release Date: TBD |