|
Download Data (XLS File) |
|
||||||||
|
||||||||
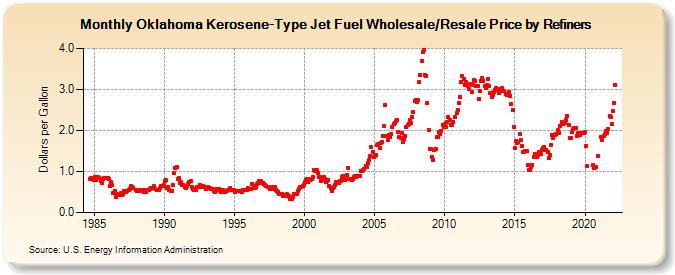
| Oklahoma Kerosene-Type Jet Fuel Wholesale/Resale Price by Refiners (Dollars per Gallon) | ||||||||
| Year | Jan | Feb | Mar | Apr | May | Jun | Jul | Aug | Sep | Oct | Nov | Dec |
|---|---|---|---|---|---|---|---|---|---|---|---|---|
| 1984 | 0.822 | 0.836 | 0.840 | 0.797 | ||||||||
| 1985 | 0.874 | 0.792 | 0.871 | 0.858 | 0.837 | 0.768 | 0.731 | 0.818 | 0.831 | 0.836 | 0.838 | 0.850 |
| 1986 | 0.824 | 0.646 | 0.741 | 0.660 | 0.478 | 0.529 | 0.380 | 0.443 | 0.427 | 0.420 | 0.466 | 0.418 |
| 1987 | 0.451 | 0.521 | 0.514 | 0.505 | 0.537 | 0.554 | 0.578 | 0.654 | 0.611 | 0.606 | W | 0.554 |
| 1988 | 0.535 | 0.524 | 0.515 | 0.544 | 0.532 | 0.554 | 0.501 | 0.560 | 0.500 | 0.543 | 0.557 | 0.566 |
| 1989 | 0.591 | 0.589 | 0.593 | 0.644 | 0.573 | 0.550 | 0.541 | 0.559 | 0.608 | 0.646 | 0.648 | 0.666 |
| 1990 | 0.770 | 0.784 | 0.607 | 0.621 | 0.553 | 0.522 | 0.536 | 0.670 | 0.962 | 1.097 | 1.098 | 0.807 |
| 1991 | 0.834 | 0.720 | 0.752 | 0.676 | 0.664 | 0.615 | 0.604 | 0.651 | 0.689 | 0.736 | 0.759 | 0.628 |
| 1992 | 0.570 | 0.558 | 0.566 | 0.560 | 0.626 | 0.628 | 0.670 | 0.616 | 0.632 | 0.655 | 0.628 | 0.572 |
| 1993 | 0.591 | 0.628 | 0.608 | 0.602 | 0.572 | 0.565 | 0.523 | 0.513 | 0.556 | 0.582 | 0.585 | 0.534 |
| 1994 | 0.504 | 0.552 | 0.538 | 0.501 | 0.493 | 0.515 | 0.548 | 0.559 | 0.602 | 0.554 | 0.548 | 0.561 |
| 1995 | 0.510 | 0.515 | 0.516 | 0.518 | 0.536 | 0.533 | 0.508 | 0.542 | 0.559 | 0.546 | 0.549 | 0.605 |
| 1996 | 0.583 | 0.562 | 0.580 | 0.702 | 0.655 | 0.589 | 0.613 | 0.700 | 0.719 | 0.773 | 0.761 | 0.728 |
| 1997 | 0.721 | 0.705 | 0.664 | 0.637 | 0.621 | 0.612 | 0.575 | 0.589 | 0.582 | 0.618 | 0.611 | 0.543 |
| 1998 | 0.517 | 0.497 | 0.454 | 0.454 | 0.442 | 0.412 | 0.410 | 0.397 | 0.425 | 0.444 | 0.413 | 0.340 |
| 1999 | 0.349 | 0.335 | 0.377 | 0.450 | 0.445 | 0.441 | 0.514 | 0.572 | 0.634 | 0.629 | 0.643 | 0.669 |
| 2000 | 0.741 | 0.794 | 0.806 | 0.738 | 0.783 | 0.821 | 0.829 | 0.860 | 1.040 | 1.002 | 1.033 | 0.963 |
| 2001 | 0.869 | 0.856 | 0.779 | 0.782 | 0.875 | 0.822 | 0.748 | 0.769 | 0.799 | 0.653 | 0.603 | 0.532 |
| 2002 | 0.590 | 0.619 | 0.676 | 0.755 | 0.755 | 0.727 | 0.765 | 0.778 | 0.863 | 0.885 | 0.795 | 0.814 |
| 2003 | 0.926 | 1.094 | NA | 0.829 | 0.801 | 0.819 | 0.863 | 0.901 | 0.856 | 0.896 | 0.887 | 0.898 |
| 2004 | 1.015 | 1.022 | 1.034 | 1.068 | 1.137 | 1.114 | 1.198 | 1.269 | 1.367 | 1.589 | 1.481 | 1.346 |
| 2005 | 1.383 | 1.407 | 1.645 | 1.659 | 1.572 | 1.698 | 1.721 | 1.854 | 2.097 | 2.616 | 1.873 | 1.761 |
| 2006 | 1.880 | 1.830 | 1.918 | 2.089 | 2.159 | 2.171 | 2.225 | 2.251 | 1.969 | 1.835 | 1.820 | 1.930 |
| 2007 | 1.709 | 1.796 | 1.876 | 2.089 | 2.126 | 2.152 | 2.256 | 2.194 | 2.322 | 2.438 | 2.729 | 2.733 |
| 2008 | 2.697 | 2.731 | 3.173 | 3.349 | 3.692 | 3.904 | 3.957 | 3.348 | 3.336 | 2.659 | 2.021 | 1.550 |
| 2009 | 1.554 | 1.362 | 1.282 | 1.518 | 1.555 | 1.829 | 1.829 | 1.969 | 1.919 | 1.996 | 2.143 | 2.094 |
| 2010 | 2.155 | 2.095 | 2.198 | 2.330 | 2.251 | 2.137 | 2.140 | 2.211 | NA | 2.328 | 2.415 | 2.509 |
| 2011 | 2.674 | 2.826 | 3.180 | 3.323 | 3.256 | 3.116 | 3.175 | 3.121 | 3.095 | 3.000 | 3.133 | 2.929 |
| 2012 | 3.096 | 3.218 | 3.203 | 3.094 | 3.080 | 2.761 | 2.958 | 3.196 | 3.290 | 3.215 | 3.081 | 3.031 |
| 2013 | 3.102 | 3.257 | 3.077 | 2.920 | 2.817 | 2.865 | 2.936 | 2.990 | 3.032 | 2.994 | 2.910 | 3.014 |
| 2014 | 3.022 | 3.026 | 2.957 | 2.954 | 2.889 | 2.875 | 2.894 | 2.939 | 2.852 | 2.650 | 2.502 | 2.090 |
| 2015 | 1.574 | 1.753 | 1.704 | 1.720 | 1.919 | 1.780 | 1.626 | 1.479 | 1.483 | 1.498 | 1.499 | 1.160 |
| 2016 | 1.032 | 1.045 | 1.112 | 1.159 | 1.344 | 1.438 | 1.354 | 1.346 | 1.393 | 1.486 | 1.436 | 1.532 |
| 2017 | 1.571 | 1.607 | 1.515 | 1.535 | 1.483 | 1.332 | 1.400 | 1.647 | 1.882 | 1.810 | 1.879 | 1.908 |
| 2018 | NA | 2.000 | 1.945 | 2.104 | 2.217 | 2.153 | 2.184 | 2.184 | 2.267 | 2.352 | 2.140 | 1.823 |
| 2019 | 1.822 | 1.962 | 2.025 | 2.064 | 2.061 | 1.867 | 1.947 | 1.890 | 1.898 | 1.927 | 1.934 | 1.928 |
| 2020 | 1.952 | 1.633 | 1.128 | W | W | W | W | 1.170 | 1.082 | 1.117 | W | 1.389 |
| 2021 | W | W | 1.837 | 1.769 | 1.856 | 1.924 | 1.983 | 1.941 | 2.034 | 2.353 | 2.324 | 2.146 |
| 2022 | 2.473 | 2.669 | 3.119 | |||||||||
| - = No Data Reported; -- = Not Applicable; NA = Not Available; W = Withheld to avoid disclosure of individual company data. |
| Release Date: 6/1/2022 |
| Next Release Date: TBD |