|
Download Data (XLS File) |
|
||||||||
|
||||||||
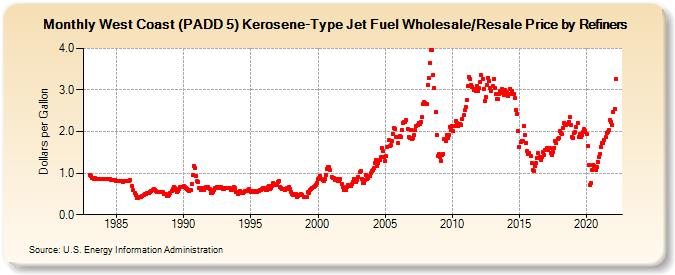
| West Coast (PADD 5) Kerosene-Type Jet Fuel Wholesale/Resale Price by Refiners (Dollars per Gallon) | ||||||||
| Year | Jan | Feb | Mar | Apr | May | Jun | Jul | Aug | Sep | Oct | Nov | Dec |
|---|---|---|---|---|---|---|---|---|---|---|---|---|
| 1983 | 0.951 | 0.933 | 0.876 | 0.879 | 0.867 | 0.880 | 0.864 | 0.852 | 0.851 | 0.853 | 0.858 | 0.850 |
| 1984 | 0.849 | 0.863 | 0.851 | 0.858 | 0.859 | 0.855 | 0.852 | 0.827 | 0.836 | 0.828 | 0.826 | 0.812 |
| 1985 | 0.815 | 0.819 | 0.812 | 0.807 | 0.811 | 0.809 | 0.787 | 0.810 | 0.800 | 0.801 | 0.806 | 0.820 |
| 1986 | 0.835 | NA | 0.694 | 0.583 | 0.518 | 0.477 | 0.403 | 0.412 | 0.428 | 0.431 | 0.425 | 0.443 |
| 1987 | 0.465 | 0.491 | 0.504 | 0.515 | 0.518 | 0.523 | 0.543 | 0.578 | 0.600 | 0.609 | 0.605 | 0.580 |
| 1988 | 0.549 | 0.555 | 0.552 | 0.547 | 0.554 | 0.553 | 0.510 | 0.488 | 0.493 | 0.445 | 0.446 | 0.468 |
| 1989 | 0.519 | 0.563 | 0.616 | 0.672 | 0.645 | 0.589 | 0.546 | 0.566 | 0.615 | 0.662 | 0.677 | 0.678 |
| 1990 | 0.684 | 0.658 | 0.642 | 0.626 | 0.604 | 0.576 | 0.583 | 0.744 | 0.962 | 1.176 | 1.114 | 0.928 |
| 1991 | 0.803 | 0.798 | 0.650 | 0.603 | 0.638 | 0.602 | 0.588 | 0.642 | 0.666 | 0.642 | 0.666 | 0.615 |
| 1992 | 0.532 | 0.533 | 0.543 | 0.589 | 0.638 | 0.649 | 0.660 | 0.662 | 0.651 | 0.673 | 0.645 | 0.622 |
| 1993 | 0.615 | 0.654 | 0.639 | 0.637 | 0.632 | 0.634 | 0.589 | 0.593 | 0.611 | 0.664 | 0.635 | 0.537 |
| 1994 | 0.507 | 0.541 | 0.578 | 0.523 | 0.522 | 0.523 | 0.542 | 0.559 | 0.570 | 0.587 | 0.617 | 0.563 |
| 1995 | 0.555 | 0.569 | 0.553 | 0.553 | 0.575 | 0.556 | 0.559 | 0.563 | 0.587 | 0.593 | 0.617 | 0.631 |
| 1996 | 0.638 | 0.589 | 0.591 | 0.663 | 0.700 | 0.617 | 0.642 | 0.698 | 0.760 | 0.725 | 0.708 | 0.744 |
| 1997 | 0.791 | 0.801 | 0.673 | 0.649 | 0.628 | 0.623 | 0.588 | 0.620 | 0.632 | 0.650 | 0.659 | 0.617 |
| 1998 | 0.555 | 0.508 | 0.468 | 0.487 | 0.488 | 0.438 | 0.447 | 0.480 | 0.474 | 0.491 | 0.475 | 0.423 |
| 1999 | 0.428 | 0.415 | 0.428 | 0.546 | 0.531 | 0.600 | 0.619 | 0.651 | 0.676 | 0.686 | 0.722 | 0.756 |
| 2000 | 0.853 | 0.877 | 0.921 | 0.861 | 0.825 | 0.818 | 0.856 | 0.950 | 1.108 | 1.158 | 1.139 | 1.067 |
| 2001 | 0.914 | 0.891 | 0.875 | 0.838 | 0.845 | 0.869 | 0.822 | 0.800 | 0.856 | 0.738 | 0.671 | 0.591 |
| 2002 | 0.616 | 0.601 | 0.672 | 0.712 | 0.699 | 0.697 | 0.730 | 0.780 | 0.869 | 0.846 | 0.779 | 0.831 |
| 2003 | 0.914 | 1.016 | 1.044 | 0.870 | 0.768 | 0.762 | 0.841 | 0.947 | 0.855 | 0.880 | 0.935 | 0.994 |
| 2004 | 1.051 | 1.079 | 1.114 | 1.244 | 1.320 | 1.181 | 1.240 | 1.312 | 1.381 | 1.599 | 1.535 | 1.396 |
| 2005 | 1.291 | 1.401 | 1.628 | 1.798 | 1.648 | 1.668 | 1.771 | 1.947 | 2.081 | 2.072 | 1.858 | 1.733 |
| 2006 | 1.859 | 1.886 | 1.872 | 2.042 | 2.207 | 2.218 | 2.221 | 2.273 | 2.061 | 1.873 | 1.854 | 2.048 |
| 2007 | 1.826 | 1.846 | 1.909 | 2.034 | 2.129 | 2.157 | 2.212 | 2.193 | 2.234 | 2.339 | 2.668 | 2.699 |
| 2008 | 2.675 | 2.674 | 3.111 | 3.277 | 3.660 | 3.966 | 3.963 | 3.372 | 3.044 | 2.468 | 1.927 | 1.413 |
| 2009 | 1.453 | 1.383 | 1.298 | 1.444 | 1.472 | 1.819 | 1.778 | 1.910 | 1.851 | 1.926 | 2.119 | 2.036 |
| 2010 | 2.141 | 2.014 | 2.130 | 2.263 | 2.211 | 2.139 | 2.160 | 2.176 | 2.163 | 2.307 | 2.388 | 2.510 |
| 2011 | 2.593 | 2.759 | 3.094 | 3.323 | 3.254 | 3.118 | 3.078 | 2.995 | 3.022 | 2.986 | 3.106 | 2.987 |
| 2012 | 3.052 | 3.189 | 3.366 | 3.275 | 3.034 | 2.731 | 2.820 | 3.110 | 3.295 | 3.213 | 3.053 | 2.987 |
| 2013 | 3.085 | 3.275 | 3.043 | 2.914 | 2.772 | 2.785 | 2.912 | 2.982 | 3.030 | 2.919 | 2.872 | 3.007 |
| 2014 | 2.941 | 2.934 | 2.849 | 2.914 | 3.031 | 2.974 | 2.908 | 2.913 | 2.801 | 2.530 | 2.425 | 2.003 |
| 2015 | 1.637 | 1.741 | 1.781 | 1.764 | 2.130 | 1.917 | 1.730 | 1.526 | 1.472 | 1.489 | 1.424 | 1.241 |
| 2016 | 1.072 | 1.052 | 1.163 | 1.232 | 1.363 | 1.478 | 1.384 | 1.324 | 1.376 | 1.509 | 1.444 | 1.554 |
| 2017 | 1.568 | 1.604 | 1.557 | 1.593 | 1.489 | 1.431 | 1.519 | 1.605 | 1.761 | 1.721 | 1.822 | 1.853 |
| 2018 | 2.003 | 1.960 | 1.934 | 2.096 | 2.213 | 2.183 | 2.169 | 2.173 | 2.240 | 2.343 | 2.150 | 1.871 |
| 2019 | 1.850 | 1.973 | 1.995 | 2.108 | 2.208 | 1.876 | 1.938 | 1.859 | 1.921 | 1.988 | 2.052 | 2.010 |
| 2020 | 1.945 | 1.662 | 1.203 | 0.715 | 0.768 | 1.087 | 1.205 | 1.166 | 1.073 | 1.137 | 1.276 | 1.388 |
| 2021 | 1.469 | 1.619 | 1.716 | 1.714 | 1.801 | 1.861 | 1.974 | 1.996 | 2.026 | 2.268 | 2.239 | 2.152 |
| 2022 | 2.461 | 2.554 | 3.255 | |||||||||
| - = No Data Reported; -- = Not Applicable; NA = Not Available; W = Withheld to avoid disclosure of individual company data. |
| Release Date: 6/1/2022 |
| Next Release Date: TBD |