|
Download Data (XLS File) |
|
||||||||
|
||||||||
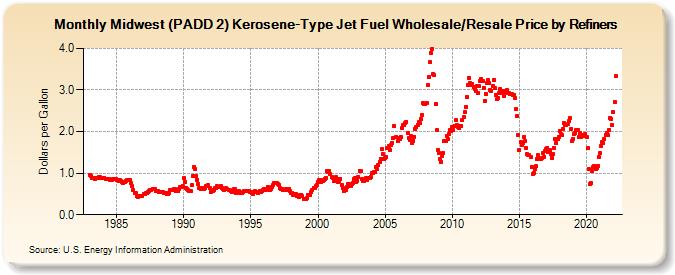
| Midwest (PADD 2) Kerosene-Type Jet Fuel Wholesale/Resale Price by Refiners (Dollars per Gallon) | ||||||||
| Year | Jan | Feb | Mar | Apr | May | Jun | Jul | Aug | Sep | Oct | Nov | Dec |
|---|---|---|---|---|---|---|---|---|---|---|---|---|
| 1983 | 0.962 | 0.928 | 0.878 | 0.874 | 0.884 | 0.860 | 0.883 | 0.888 | 0.897 | 0.901 | 0.889 | 0.877 |
| 1984 | 0.875 | 0.890 | 0.870 | 0.864 | 0.858 | 0.863 | 0.844 | 0.832 | 0.842 | 0.856 | 0.861 | 0.850 |
| 1985 | 0.831 | 0.824 | 0.804 | 0.827 | 0.815 | 0.796 | 0.773 | 0.787 | 0.806 | 0.823 | 0.826 | 0.842 |
| 1986 | 0.833 | 0.754 | 0.679 | 0.596 | 0.524 | 0.513 | 0.439 | 0.431 | 0.458 | 0.452 | 0.460 | 0.459 |
| 1987 | 0.490 | 0.510 | 0.511 | 0.522 | 0.536 | 0.564 | 0.586 | 0.599 | 0.608 | 0.617 | 0.615 | 0.581 |
| 1988 | 0.565 | 0.560 | 0.548 | 0.543 | 0.550 | 0.537 | 0.525 | 0.520 | 0.512 | 0.499 | 0.501 | 0.534 |
| 1989 | 0.596 | 0.603 | 0.583 | 0.621 | 0.608 | 0.575 | 0.576 | 0.576 | 0.620 | 0.656 | 0.673 | 0.696 |
| 1990 | 0.873 | 0.787 | 0.648 | 0.625 | 0.591 | 0.559 | 0.572 | 0.708 | 0.933 | 1.151 | 1.098 | 0.927 |
| 1991 | 0.841 | 0.740 | 0.631 | 0.611 | 0.638 | 0.614 | 0.616 | 0.651 | 0.687 | 0.697 | 0.712 | 0.640 |
| 1992 | 0.549 | 0.583 | 0.578 | 0.595 | 0.644 | 0.652 | 0.679 | 0.655 | 0.660 | 0.683 | 0.651 | 0.609 |
| 1993 | 0.603 | 0.621 | 0.633 | 0.608 | 0.602 | 0.601 | 0.559 | 0.544 | 0.578 | 0.611 | 0.607 | 0.531 |
| 1994 | 0.535 | 0.561 | 0.531 | 0.522 | 0.530 | 0.549 | 0.559 | 0.570 | 0.565 | 0.567 | 0.567 | 0.539 |
| 1995 | 0.535 | 0.519 | 0.509 | 0.537 | 0.564 | 0.544 | 0.523 | 0.552 | 0.571 | 0.556 | 0.573 | 0.603 |
| 1996 | 0.613 | 0.591 | 0.612 | 0.676 | 0.640 | 0.585 | 0.615 | 0.666 | 0.726 | 0.769 | 0.760 | 0.753 |
| 1997 | 0.740 | 0.715 | 0.641 | 0.617 | 0.621 | 0.605 | 0.595 | 0.610 | 0.596 | 0.629 | 0.626 | 0.568 |
| 1998 | 0.531 | 0.517 | 0.478 | 0.491 | 0.490 | 0.460 | 0.454 | 0.434 | 0.465 | 0.484 | 0.449 | 0.373 |
| 1999 | 0.381 | 0.369 | 0.404 | 0.485 | 0.473 | 0.477 | 0.538 | 0.600 | 0.651 | 0.650 | 0.682 | 0.723 |
| 2000 | 0.786 | 0.826 | 0.837 | 0.780 | 0.807 | 0.837 | 0.859 | 0.890 | 1.060 | 1.033 | 1.044 | 0.989 |
| 2001 | 0.904 | 0.894 | 0.810 | 0.821 | 0.898 | 0.861 | 0.775 | 0.818 | 0.867 | 0.721 | 0.633 | 0.568 |
| 2002 | 0.584 | 0.603 | 0.678 | 0.733 | 0.729 | 0.698 | 0.741 | 0.767 | 0.852 | 0.880 | 0.791 | 0.814 |
| 2003 | 0.912 | 1.060 | 1.051 | 0.855 | 0.804 | 0.808 | 0.842 | 0.888 | 0.836 | 0.882 | 0.891 | 0.914 |
| 2004 | 1.012 | 1.012 | 1.017 | 1.037 | 1.145 | 1.110 | 1.189 | 1.278 | 1.350 | 1.569 | 1.459 | 1.338 |
| 2005 | 1.354 | 1.383 | 1.602 | 1.650 | 1.555 | 1.687 | 1.728 | 1.840 | 2.129 | NA | 1.861 | 1.765 |
| 2006 | 1.846 | 1.819 | 1.875 | 2.078 | 2.152 | 2.159 | 2.195 | 2.239 | 1.955 | 1.842 | 1.799 | 1.903 |
| 2007 | 1.716 | 1.781 | 1.877 | 2.072 | 2.109 | 2.158 | 2.223 | 2.202 | 2.300 | 2.397 | 2.685 | 2.672 |
| 2008 | 2.671 | 2.688 | 3.112 | 3.320 | 3.666 | 3.896 | 3.994 | 3.390 | 3.352 | 2.666 | 2.029 | 1.554 |
| 2009 | 1.488 | 1.337 | 1.273 | 1.422 | 1.489 | 1.782 | 1.772 | 1.905 | 1.821 | 1.946 | 2.036 | 2.017 |
| 2010 | 2.102 | 2.032 | 2.143 | 2.266 | 2.164 | 2.101 | 2.075 | 2.135 | 2.139 | 2.269 | 2.349 | 2.465 |
| 2011 | 2.602 | 2.825 | 3.126 | 3.286 | 3.162 | 3.109 | 3.153 | 3.070 | 3.025 | 2.985 | 3.097 | 2.935 |
| 2012 | 3.095 | 3.225 | 3.266 | 3.206 | 3.048 | 2.745 | 2.914 | 3.174 | 3.229 | 3.158 | 3.001 | 2.980 |
| 2013 | 3.101 | 3.245 | 3.038 | 2.890 | 2.772 | 2.808 | 2.916 | 3.012 | 2.983 | 2.930 | 2.858 | 2.984 |
| 2014 | 2.955 | 2.993 | 2.934 | 2.922 | 2.900 | 2.897 | 2.868 | 2.884 | 2.804 | 2.543 | 2.379 | 1.926 |
| 2015 | 1.557 | 1.739 | 1.686 | 1.717 | 1.880 | 1.777 | 1.613 | 1.454 | 1.437 | 1.440 | 1.390 | 1.154 |
| 2016 | 0.988 | 1.014 | 1.104 | 1.165 | 1.328 | 1.426 | 1.337 | 1.348 | 1.372 | 1.485 | 1.398 | 1.532 |
| 2017 | 1.576 | 1.612 | 1.512 | 1.555 | 1.468 | 1.362 | 1.455 | 1.615 | 1.810 | 1.728 | 1.819 | 1.876 |
| 2018 | 2.012 | 1.932 | 1.908 | 2.062 | 2.204 | 2.155 | 2.161 | 2.172 | 2.247 | 2.318 | 2.060 | 1.775 |
| 2019 | 1.826 | 1.951 | 1.976 | 2.032 | 2.045 | 1.879 | 1.966 | 1.870 | 1.913 | 1.923 | 1.896 | 1.942 |
| 2020 | 1.878 | 1.600 | 1.094 | 0.731 | 0.761 | 1.041 | 1.158 | 1.179 | 1.093 | 1.126 | 1.183 | 1.386 |
| 2021 | 1.476 | 1.644 | 1.755 | 1.716 | 1.819 | 1.920 | 1.963 | 1.908 | 2.037 | 2.327 | 2.308 | 2.149 |
| 2022 | 2.461 | 2.715 | 3.329 | |||||||||
| - = No Data Reported; -- = Not Applicable; NA = Not Available; W = Withheld to avoid disclosure of individual company data. |
| Release Date: 6/1/2022 |
| Next Release Date: TBD |