|
Download Data (XLS File) |
|
||||||||
|
||||||||
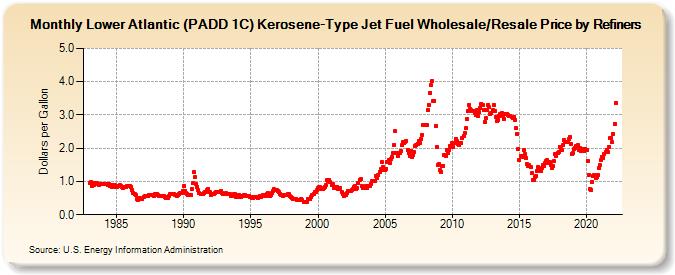
| Lower Atlantic (PADD 1C) Kerosene-Type Jet Fuel Wholesale/Resale Price by Refiners (Dollars per Gallon) | ||||||||
| Year | Jan | Feb | Mar | Apr | May | Jun | Jul | Aug | Sep | Oct | Nov | Dec |
|---|---|---|---|---|---|---|---|---|---|---|---|---|
| 1983 | 0.949 | 0.995 | 0.863 | 0.968 | 0.884 | 0.946 | 0.939 | 0.935 | 0.908 | 0.911 | 0.934 | 0.932 |
| 1984 | 0.916 | 0.928 | 0.927 | 0.925 | 0.907 | 0.916 | 0.875 | 0.884 | 0.845 | 0.900 | 0.881 | 0.826 |
| 1985 | 0.845 | 0.866 | 0.860 | 0.882 | 0.865 | 0.832 | 0.798 | 0.844 | 0.841 | 0.863 | 0.854 | 0.855 |
| 1986 | 0.864 | 0.834 | 0.747 | 0.652 | 0.619 | 0.581 | 0.475 | 0.456 | 0.490 | 0.499 | 0.484 | 0.478 |
| 1987 | 0.529 | 0.553 | 0.550 | 0.563 | 0.552 | 0.598 | 0.585 | 0.596 | 0.594 | 0.576 | 0.616 | 0.590 |
| 1988 | 0.616 | 0.585 | 0.570 | 0.557 | 0.573 | 0.552 | 0.557 | 0.531 | 0.494 | 0.520 | 0.514 | 0.561 |
| 1989 | 0.625 | 0.624 | 0.609 | 0.633 | 0.595 | 0.582 | 0.571 | 0.579 | 0.611 | 0.655 | 0.656 | 0.719 |
| 1990 | 0.876 | 0.713 | 0.649 | 0.628 | 0.596 | 0.591 | 0.580 | 0.781 | 0.950 | 1.276 | 1.126 | 0.910 |
| 1991 | 0.844 | 0.731 | 0.645 | 0.624 | 0.634 | 0.633 | 0.640 | 0.678 | 0.689 | 0.735 | 0.766 | 0.675 |
| 1992 | 0.603 | 0.632 | 0.612 | 0.632 | 0.662 | 0.689 | 0.696 | 0.685 | 0.687 | 0.708 | 0.662 | 0.623 |
| 1993 | 0.622 | 0.628 | 0.644 | 0.631 | 0.631 | 0.617 | 0.567 | 0.566 | 0.586 | 0.633 | 0.611 | 0.539 |
| 1994 | 0.570 | 0.593 | 0.538 | 0.545 | 0.549 | 0.562 | 0.584 | 0.582 | 0.569 | 0.548 | 0.558 | 0.539 |
| 1995 | 0.519 | 0.516 | 0.493 | 0.536 | 0.547 | 0.538 | 0.509 | 0.532 | 0.555 | 0.542 | 0.564 | 0.581 |
| 1996 | 0.601 | 0.575 | 0.608 | 0.661 | 0.610 | 0.563 | 0.600 | 0.645 | 0.716 | 0.765 | 0.736 | 0.753 |
| 1997 | 0.726 | 0.694 | 0.616 | 0.601 | 0.590 | 0.575 | 0.578 | 0.607 | 0.590 | 0.621 | 0.609 | 0.558 |
| 1998 | 0.527 | 0.516 | 0.475 | 0.482 | 0.478 | 0.447 | 0.447 | 0.431 | 0.452 | 0.481 | 0.440 | 0.373 |
| 1999 | 0.381 | 0.368 | 0.395 | 0.474 | 0.473 | 0.473 | 0.534 | 0.591 | 0.627 | 0.669 | 0.686 | 0.730 |
| 2000 | 0.798 | 0.833 | 0.821 | 0.779 | 0.785 | 0.814 | 0.845 | 0.887 | 1.051 | 1.017 | 1.046 | 0.982 |
| 2001 | 0.884 | 0.909 | 0.810 | 0.806 | 0.846 | 0.829 | 0.765 | 0.786 | 0.789 | 0.691 | 0.629 | 0.568 |
| 2002 | 0.588 | 0.602 | 0.644 | 0.698 | 0.707 | 0.704 | 0.734 | 0.759 | 0.836 | 0.853 | 0.774 | 0.798 |
| 2003 | 0.949 | 1.058 | 1.062 | 0.876 | 0.816 | 0.800 | 0.831 | 0.872 | 0.815 | 0.867 | 0.878 | 0.925 |
| 2004 | 1.019 | 1.010 | 1.019 | 1.020 | 1.154 | 1.106 | 1.183 | 1.286 | 1.360 | 1.573 | 1.442 | 1.340 |
| 2005 | 1.340 | 1.387 | 1.598 | 1.657 | 1.560 | 1.675 | 1.733 | 1.846 | 2.093 | 2.503 | 1.845 | 1.771 |
| 2006 | 1.864 | 1.856 | 1.915 | 2.087 | 2.171 | 2.155 | 2.195 | 2.225 | 1.946 | 1.844 | 1.777 | 1.905 |
| 2007 | 1.744 | 1.794 | 1.872 | 2.078 | 2.095 | 2.137 | 2.205 | 2.170 | 2.274 | 2.397 | 2.698 | 2.683 |
| 2008 | 2.702 | 2.709 | 3.142 | 3.307 | 3.670 | 3.906 | 4.025 | 3.404 | 3.414 | 2.660 | 2.041 | 1.508 |
| 2009 | 1.535 | 1.341 | 1.299 | 1.463 | 1.472 | 1.807 | 1.779 | 1.950 | 1.856 | 1.936 | 2.074 | 2.046 |
| 2010 | 2.151 | 2.042 | 2.170 | 2.291 | 2.201 | 2.118 | 2.087 | 2.170 | 2.163 | 2.298 | 2.368 | 2.460 |
| 2011 | 2.592 | 2.869 | 3.117 | 3.300 | 3.192 | 3.136 | 3.113 | 3.107 | 3.065 | 2.992 | 3.138 | 2.972 |
| 2012 | 3.093 | 3.220 | 3.337 | 3.305 | 3.156 | 2.781 | 2.898 | 3.150 | 3.305 | 3.229 | 3.041 | 3.056 |
| 2013 | 3.153 | 3.301 | 3.122 | 2.946 | 2.817 | 2.855 | 2.954 | 3.038 | 3.055 | 2.960 | 2.885 | 3.021 |
| 2014 | 3.026 | 3.028 | 2.997 | 2.959 | 2.955 | 2.942 | 2.915 | 2.925 | 2.860 | 2.603 | 2.431 | 1.976 |
| 2015 | 1.650 | 1.754 | 1.759 | 1.738 | 1.931 | 1.838 | 1.690 | 1.521 | 1.463 | 1.480 | 1.441 | 1.246 |
| 2016 | 1.048 | 1.043 | 1.128 | 1.170 | 1.328 | 1.442 | 1.382 | 1.311 | 1.397 | 1.487 | 1.460 | 1.541 |
| 2017 | 1.605 | 1.637 | 1.553 | 1.591 | 1.502 | 1.403 | 1.459 | 1.613 | 1.832 | 1.756 | 1.853 | 1.888 |
| 2018 | 2.047 | 1.986 | 1.942 | 2.089 | 2.244 | 2.198 | 2.191 | 2.195 | 2.266 | 2.341 | 2.118 | 1.836 |
| 2019 | 1.842 | 1.975 | 2.014 | 2.057 | 2.081 | 1.935 | 1.996 | 1.907 | 1.940 | 1.972 | 1.908 | 1.982 |
| 2020 | 1.931 | 1.619 | 1.200 | 0.767 | 0.757 | 0.997 | 1.152 | 1.199 | 1.112 | 1.132 | 1.188 | 1.393 |
| 2021 | 1.489 | 1.642 | 1.750 | 1.713 | 1.818 | 1.900 | 1.951 | 1.887 | 2.029 | 2.298 | 2.302 | 2.174 |
| 2022 | 2.428 | 2.738 | 3.345 | |||||||||
| - = No Data Reported; -- = Not Applicable; NA = Not Available; W = Withheld to avoid disclosure of individual company data. |
| Release Date: 6/1/2022 |
| Next Release Date: TBD |