|
Download Data (XLS File) |
|
||||||||
|
||||||||
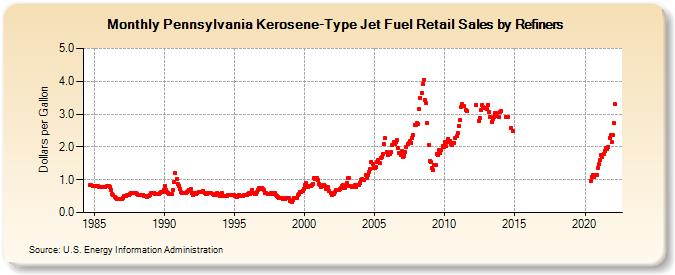
| Pennsylvania Kerosene-Type Jet Fuel Retail Sales by Refiners (Dollars per Gallon) | ||||||||
| Year | Jan | Feb | Mar | Apr | May | Jun | Jul | Aug | Sep | Oct | Nov | Dec |
|---|---|---|---|---|---|---|---|---|---|---|---|---|
| 1984 | 0.830 | 0.827 | 0.823 | 0.813 | ||||||||
| 1985 | 0.808 | 0.803 | 0.798 | 0.794 | 0.782 | 0.776 | 0.776 | 0.774 | 0.782 | 0.789 | 0.797 | 0.804 |
| 1986 | 0.801 | 0.787 | 0.695 | 0.580 | 0.522 | 0.484 | 0.442 | 0.403 | 0.416 | 0.415 | 0.419 | 0.422 |
| 1987 | 0.455 | 0.497 | 0.499 | 0.507 | 0.521 | 0.542 | 0.559 | 0.581 | 0.582 | 0.590 | 0.600 | 0.581 |
| 1988 | 0.565 | 0.549 | 0.534 | 0.524 | 0.536 | 0.529 | 0.505 | 0.500 | 0.492 | 0.475 | 0.493 | 0.535 |
| 1989 | 0.584 | 0.601 | 0.589 | 0.599 | 0.579 | 0.565 | 0.564 | 0.555 | 0.590 | 0.634 | 0.632 | 0.681 |
| 1990 | 0.823 | 0.685 | 0.616 | 0.595 | 0.577 | 0.554 | 0.554 | 0.693 | 0.921 | 1.190 | 1.027 | 0.884 |
| 1991 | 0.800 | 0.707 | 0.613 | 0.588 | 0.596 | 0.593 | 0.609 | 0.633 | 0.658 | 0.696 | 0.710 | 0.610 |
| 1992 | 0.547 | 0.586 | 0.567 | 0.570 | 0.604 | 0.638 | 0.641 | 0.625 | 0.640 | 0.661 | 0.605 | 0.570 |
| 1993 | 0.567 | 0.585 | 0.600 | 0.581 | 0.582 | 0.563 | 0.528 | 0.521 | 0.550 | 0.598 | 0.573 | 0.500 |
| 1994 | 0.530 | 0.587 | 0.496 | 0.499 | 0.504 | 0.517 | 0.542 | 0.536 | 0.520 | 0.531 | 0.548 | 0.522 |
| 1995 | 0.514 | 0.496 | 0.479 | 0.515 | 0.537 | 0.519 | 0.494 | 0.516 | 0.541 | 0.527 | 0.548 | 0.576 |
| 1996 | 0.601 | 0.573 | 0.609 | 0.688 | 0.602 | 0.556 | 0.572 | 0.626 | 0.693 | 0.737 | 0.719 | 0.740 |
| 1997 | 0.715 | 0.683 | 0.591 | 0.581 | 0.577 | 0.559 | 0.557 | 0.590 | 0.565 | 0.600 | 0.581 | 0.536 |
| 1998 | 0.505 | 0.487 | 0.445 | 0.454 | 0.450 | 0.422 | 0.422 | 0.404 | 0.435 | 0.451 | 0.429 | 0.342 |
| 1999 | 0.344 | 0.327 | 0.370 | 0.451 | 0.447 | 0.448 | 0.525 | 0.575 | 0.625 | 0.629 | 0.667 | 0.731 |
| 2000 | 0.848 | 0.899 | 0.823 | 0.776 | 0.798 | 0.798 | 0.840 | 0.867 | 1.048 | 1.012 | 1.058 | 0.989 |
| 2001 | 0.882 | 0.851 | 0.789 | 0.799 | 0.839 | 0.814 | 0.727 | 0.767 | 0.785 | 0.647 | 0.594 | 0.536 |
| 2002 | 0.570 | 0.572 | 0.630 | 0.684 | 0.695 | 0.676 | 0.715 | 0.735 | 0.807 | 0.832 | 0.746 | 0.799 |
| 2003 | 0.908 | 1.053 | 1.055 | 0.794 | 0.772 | 0.769 | 0.804 | 0.839 | 0.776 | 0.835 | 0.850 | 0.903 |
| 2004 | 0.993 | 1.015 | 0.989 | 0.982 | 1.143 | 1.058 | 1.136 | 1.245 | 1.327 | 1.555 | 1.468 | 1.367 |
| 2005 | 1.351 | 1.381 | 1.554 | 1.613 | 1.508 | 1.652 | 1.692 | 1.796 | 2.088 | 2.257 | 1.831 | 1.738 |
| 2006 | 1.812 | 1.789 | 1.856 | 2.045 | 2.138 | 2.093 | 2.143 | 2.207 | 1.963 | 1.805 | 1.751 | 1.866 |
| 2007 | 1.704 | 1.737 | 1.840 | 2.006 | 2.082 | 2.110 | 2.173 | 2.130 | 2.267 | 2.353 | 2.660 | 2.680 |
| 2008 | 2.716 | 2.685 | 3.153 | 3.502 | 3.654 | 3.904 | 4.052 | 3.421 | 3.333 | 2.729 | 2.047 | 1.585 |
| 2009 | 1.526 | 1.366 | 1.281 | 1.452 | 1.462 | 1.792 | 1.749 | 1.912 | 1.816 | 1.891 | 2.042 | 1.990 |
| 2010 | 2.134 | 2.012 | 2.139 | 2.249 | 2.185 | 2.087 | 2.070 | 2.126 | 2.130 | 2.256 | 2.335 | 2.430 |
| 2011 | 2.640 | 2.819 | 3.219 | 3.303 | 3.232 | W | 3.114 | 3.087 | W | W | W | W |
| 2012 | W | W | W | 3.284 | W | 2.791 | 2.885 | 3.125 | 3.261 | 3.222 | 3.175 | W |
| 2013 | 3.153 | 3.288 | 3.071 | 2.906 | 2.766 | 2.852 | 2.908 | 3.018 | 3.020 | 2.937 | 2.920 | 3.049 |
| 2014 | 3.086 | W | W | W | 2.919 | W | 2.900 | W | W | 2.580 | 2.471 | W |
| 2015 | W | W | W | W | W | W | W | W | W | W | W | W |
| 2016 | W | W | W | W | W | W | W | W | W | W | W | W |
| 2017 | W | W | W | W | W | W | W | W | W | W | W | W |
| 2018 | W | W | W | W | W | W | W | W | W | W | W | W |
| 2019 | W | W | W | W | W | W | W | W | W | W | W | W |
| 2020 | W | W | W | W | W | 0.947 | 1.098 | 1.149 | 1.092 | 1.130 | 1.145 | 1.364 |
| 2021 | 1.464 | 1.593 | 1.741 | 1.687 | 1.798 | 1.876 | 1.957 | 1.943 | 2.006 | 2.285 | 2.356 | 2.151 |
| 2022 | 2.350 | 2.723 | 3.292 | |||||||||
| - = No Data Reported; -- = Not Applicable; NA = Not Available; W = Withheld to avoid disclosure of individual company data. |
| Release Date: 6/1/2022 |
| Next Release Date: TBD |