|
Download Data (XLS File) |
|
||||||||
|
||||||||
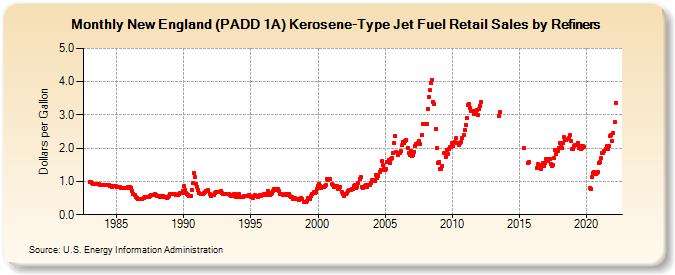
| New England (PADD 1A) Kerosene-Type Jet Fuel Retail Sales by Refiners (Dollars per Gallon) | ||||||||
| Year | Jan | Feb | Mar | Apr | May | Jun | Jul | Aug | Sep | Oct | Nov | Dec |
|---|---|---|---|---|---|---|---|---|---|---|---|---|
| 1983 | 0.992 | 0.979 | 0.960 | 0.937 | 0.937 | 0.933 | 0.921 | 0.919 | 0.914 | 0.908 | 0.905 | 0.893 |
| 1984 | 0.887 | 0.893 | 0.897 | 0.890 | 0.889 | 0.879 | 0.875 | 0.853 | 0.844 | 0.862 | 0.858 | 0.850 |
| 1985 | 0.846 | 0.839 | 0.826 | 0.825 | 0.816 | 0.816 | 0.808 | 0.808 | 0.810 | 0.815 | 0.829 | 0.834 |
| 1986 | 0.831 | 0.813 | 0.715 | 0.634 | 0.584 | 0.540 | 0.497 | 0.464 | 0.465 | 0.458 | 0.458 | 0.464 |
| 1987 | 0.504 | 0.540 | 0.530 | 0.527 | 0.533 | 0.544 | 0.564 | 0.600 | 0.598 | 0.604 | 0.612 | 0.598 |
| 1988 | 0.560 | 0.574 | 0.559 | 0.543 | 0.555 | 0.551 | 0.530 | 0.529 | 0.519 | 0.510 | 0.535 | 0.574 |
| 1989 | 0.630 | 0.631 | 0.629 | 0.635 | 0.613 | 0.591 | 0.582 | 0.590 | 0.614 | 0.652 | 0.662 | 0.709 |
| 1990 | 0.852 | 0.753 | 0.645 | 0.626 | 0.600 | 0.569 | 0.576 | 0.743 | 0.965 | 1.247 | 1.121 | 0.924 |
| 1991 | 0.845 | 0.747 | 0.640 | 0.617 | 0.625 | 0.629 | 0.639 | 0.673 | 0.702 | 0.725 | 0.734 | 0.634 |
| 1992 | 0.564 | 0.604 | 0.582 | 0.595 | 0.638 | 0.676 | 0.680 | 0.671 | 0.678 | 0.699 | 0.646 | 0.609 |
| 1993 | 0.608 | 0.614 | 0.631 | 0.617 | 0.621 | 0.603 | 0.570 | 0.561 | 0.584 | 0.632 | 0.612 | 0.535 |
| 1994 | 0.567 | 0.618 | 0.530 | 0.534 | 0.537 | 0.541 | 0.570 | 0.572 | 0.555 | 0.563 | 0.581 | 0.560 |
| 1995 | 0.542 | 0.525 | 0.508 | 0.549 | 0.578 | 0.557 | 0.532 | 0.553 | 0.578 | 0.565 | 0.582 | 0.605 |
| 1996 | 0.633 | 0.599 | 0.636 | 0.707 | 0.639 | 0.591 | 0.611 | 0.656 | 0.726 | 0.768 | 0.751 | 0.770 |
| 1997 | 0.759 | 0.723 | 0.630 | 0.615 | 0.614 | 0.594 | 0.592 | 0.626 | 0.605 | 0.637 | 0.624 | 0.575 |
| 1998 | 0.546 | 0.527 | 0.485 | 0.493 | 0.484 | 0.460 | 0.465 | 0.442 | 0.478 | 0.491 | 0.470 | 0.389 |
| 1999 | 0.383 | 0.369 | 0.409 | 0.490 | 0.485 | 0.481 | 0.559 | 0.612 | 0.671 | 0.663 | 0.697 | 0.771 |
| 2000 | 0.868 | 0.933 | 0.860 | 0.808 | 0.828 | 0.829 | 0.869 | 0.889 | 1.078 | 1.045 | 1.081 | 1.059 |
| 2001 | 0.914 | 0.895 | 0.824 | 0.834 | 0.873 | 0.857 | 0.763 | 0.807 | 0.827 | 0.686 | 0.637 | 0.576 |
| 2002 | 0.613 | 0.616 | 0.667 | 0.721 | 0.742 | 0.731 | 0.767 | 0.775 | 0.858 | 0.891 | 0.796 | 0.846 |
| 2003 | 0.962 | 1.079 | 1.132 | 0.844 | 0.812 | 0.827 | 0.853 | 0.883 | 0.841 | 0.880 | 0.896 | 0.955 |
| 2004 | 1.033 | 1.057 | 1.036 | 1.015 | 1.196 | 1.102 | 1.173 | 1.288 | 1.351 | 1.604 | 1.480 | 1.363 |
| 2005 | 1.343 | 1.369 | 1.589 | 1.648 | 1.546 | 1.685 | 1.705 | 1.855 | 2.142 | 2.377 | 1.872 | 1.791 |
| 2006 | 1.851 | 1.852 | 1.907 | 2.083 | 2.197 | 2.148 | 2.207 | 2.244 | 2.020 | 1.859 | 1.802 | 1.914 |
| 2007 | 1.770 | 1.804 | 1.893 | 2.063 | 2.132 | 2.166 | 2.229 | 2.129 | NA | 2.403 | 2.717 | 2.725 |
| 2008 | 2.742 | 2.735 | 3.189 | 3.537 | 3.737 | 3.946 | 4.043 | 3.394 | 3.319 | 2.591 | 2.002 | 1.561 |
| 2009 | 1.578 | 1.382 | 1.365 | 1.470 | NA | 1.862 | 1.748 | 1.945 | 1.811 | 1.990 | 2.038 | 2.026 |
| 2010 | 2.148 | 2.051 | 2.178 | 2.297 | 2.144 | NA | 2.084 | 2.154 | 2.189 | 2.306 | 2.397 | 2.547 |
| 2011 | 2.699 | 2.902 | 3.311 | 3.333 | 3.211 | 3.123 | 3.112 | 3.034 | 3.112 | 3.064 | 3.159 | 3.005 |
| 2012 | 3.166 | 3.283 | 3.385 | W | W | W | W | W | W | W | W | W |
| 2013 | W | W | W | W | W | W | 2.973 | 3.085 | W | W | W | W |
| 2014 | W | W | W | W | W | W | W | W | W | W | W | W |
| 2015 | W | W | W | W | 1.998 | W | W | W | 1.550 | 1.584 | W | W |
| 2016 | W | W | W | W | 1.390 | 1.517 | 1.472 | 1.366 | 1.490 | 1.540 | 1.474 | 1.564 |
| 2017 | 1.680 | 1.677 | 1.618 | 1.670 | 1.529 | 1.470 | 1.500 | 1.695 | 1.946 | 1.819 | 1.927 | 2.020 |
| 2018 | 2.142 | 2.055 | 1.994 | 2.166 | 2.329 | 2.250 | 2.242 | 2.264 | 2.313 | 2.387 | 2.220 | 1.962 |
| 2019 | 1.974 | 2.066 | 2.083 | 2.105 | 2.162 | 1.992 | 2.078 | 1.983 | 2.004 | 2.063 | 2.028 | W |
| 2020 | W | W | W | 0.790 | 0.761 | 1.129 | 1.250 | 1.273 | 1.231 | 1.245 | 1.277 | 1.548 |
| 2021 | 1.596 | 1.693 | 1.850 | 1.848 | 1.920 | 1.982 | 2.051 | 1.987 | 2.061 | 2.353 | 2.398 | 2.213 |
| 2022 | 2.459 | 2.783 | 3.360 | |||||||||
| - = No Data Reported; -- = Not Applicable; NA = Not Available; W = Withheld to avoid disclosure of individual company data. |
| Release Date: 6/1/2022 |
| Next Release Date: TBD |