|
Download Data (XLS File) |
|
||||||||
|
||||||||
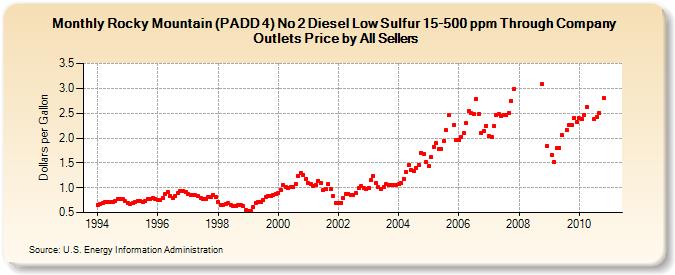
| Rocky Mountain (PADD 4) No 2 Diesel Low Sulfur 15-500 ppm Through Company Outlets Price by All Sellers (Dollars per Gallon) | ||||||||
| Year | Jan | Feb | Mar | Apr | May | Jun | Jul | Aug | Sep | Oct | Nov | Dec |
|---|---|---|---|---|---|---|---|---|---|---|---|---|
| 1994 | 0.660 | 0.679 | 0.689 | 0.710 | 0.715 | 0.716 | 0.718 | 0.733 | 0.773 | 0.774 | 0.767 | 0.724 |
| 1995 | 0.684 | 0.675 | 0.685 | 0.707 | 0.737 | 0.731 | 0.714 | 0.737 | 0.773 | 0.779 | 0.783 | 0.771 |
| 1996 | 0.757 | 0.757 | 0.785 | 0.882 | 0.916 | 0.841 | 0.799 | 0.826 | 0.886 | 0.926 | 0.931 | 0.909 |
| 1997 | 0.883 | 0.860 | 0.852 | 0.848 | 0.832 | 0.793 | 0.766 | 0.781 | 0.807 | 0.819 | 0.847 | 0.815 |
| 1998 | 0.715 | 0.658 | 0.659 | 0.666 | 0.688 | 0.648 | 0.631 | 0.633 | 0.650 | 0.660 | 0.626 | 0.558 |
| 1999 | 0.535 | 0.541 | 0.606 | 0.699 | 0.706 | 0.704 | 0.749 | 0.811 | 0.837 | 0.837 | 0.859 | 0.883 |
| 2000 | 0.895 | 0.959 | 1.045 | 1.008 | 1.002 | 1.011 | 1.022 | 1.065 | 1.237 | 1.301 | 1.256 | 1.171 |
| 2001 | 1.088 | 1.081 | 1.036 | 1.060 | 1.141 | 1.100 | 0.957 | 0.967 | 1.070 | 0.968 | 0.839 | 0.702 |
| 2002 | 0.685 | 0.697 | 0.791 | 0.881 | 0.881 | 0.857 | 0.863 | 0.901 | 0.987 | 1.027 | 0.997 | 0.972 |
| 2003 | 1.003 | 1.160 | 1.245 | 1.087 | 1.006 | 0.981 | 1.007 | 1.065 | 1.051 | 1.051 | 1.060 | 1.052 |
| 2004 | 1.068 | 1.102 | 1.182 | 1.323 | 1.451 | 1.363 | 1.333 | 1.401 | 1.466 | 1.707 | 1.688 | 1.517 |
| 2005 | 1.431 | 1.611 | 1.826 | 1.892 | 1.772 | 1.788 | 1.934 | 2.156 | 2.458 | NA | 2.265 | 1.954 |
| 2006 | 1.953 | 2.024 | 2.097 | 2.297 | 2.544 | 2.496 | 2.492 | 2.788 | 2.487 | 2.096 | 2.144 | 2.249 |
| 2007 | 2.032 | 2.022 | 2.237 | 2.457 | 2.477 | 2.435 | 2.467 | 2.461 | 2.499 | 2.746 | 2.982 | W |
| 2008 | W | W | W | W | W | W | W | W | W | 3.078 | W | 1.837 |
| 2009 | W | 1.659 | 1.523 | 1.792 | 1.803 | 2.060 | NA | 2.168 | 2.252 | 2.266 | 2.403 | 2.320 |
| 2010 | 2.396 | 2.376 | 2.467 | 2.632 | NA | NA | 2.378 | 2.433 | 2.508 | NA | 2.805 | - |
| - = No Data Reported; -- = Not Applicable; NA = Not Available; W = Withheld to avoid disclosure of individual company data. |
| Release Date: 6/1/2022 |
| Next Release Date: TBD |