|
Download Data (XLS File) |
|
||||||||
|
||||||||
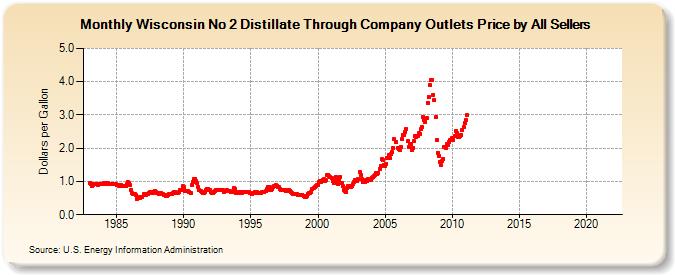
| Wisconsin No 2 Distillate Through Company Outlets Price by All Sellers (Dollars per Gallon) | ||||||||
| Year | Jan | Feb | Mar | Apr | May | Jun | Jul | Aug | Sep | Oct | Nov | Dec |
|---|---|---|---|---|---|---|---|---|---|---|---|---|
| 1983 | 0.939 | 0.930 | 0.871 | 0.892 | 0.920 | 0.921 | 0.917 | 0.907 | 0.926 | 0.929 | 0.917 | 0.911 |
| 1984 | 0.938 | 0.948 | 0.940 | 0.926 | 0.941 | 0.931 | 0.924 | 0.925 | 0.919 | 0.923 | 0.919 | 0.911 |
| 1985 | 0.894 | 0.881 | 0.877 | 0.881 | 0.890 | 0.868 | 0.853 | 0.866 | 0.873 | 0.909 | 0.970 | 0.950 |
| 1986 | 0.889 | 0.750 | 0.655 | 0.626 | 0.617 | 0.582 | 0.485 | 0.518 | 0.541 | 0.515 | 0.530 | 0.539 |
| 1987 | 0.616 | 0.603 | 0.599 | 0.613 | 0.631 | 0.657 | 0.668 | 0.676 | 0.663 | 0.696 | 0.718 | 0.683 |
| 1988 | 0.658 | 0.654 | 0.633 | 0.660 | 0.648 | 0.636 | 0.600 | 0.580 | 0.567 | 0.573 | 0.592 | 0.619 |
| 1989 | 0.634 | 0.625 | 0.649 | 0.669 | 0.679 | 0.652 | 0.657 | 0.651 | 0.689 | 0.732 | 0.732 | 0.854 |
| 1990 | 0.844 | 0.714 | 0.709 | 0.700 | 0.698 | 0.684 | 0.658 | 0.894 | 0.995 | 1.083 | 1.073 | 1.012 |
| 1991 | 0.963 | 0.836 | 0.736 | 0.701 | 0.688 | 0.658 | 0.666 | 0.697 | 0.728 | 0.771 | 0.781 | 0.734 |
| 1992 | 0.672 | 0.656 | 0.659 | 0.689 | 0.719 | 0.736 | 0.734 | 0.738 | 0.740 | 0.755 | 0.741 | 0.730 |
| 1993 | 0.693 | 0.708 | 0.720 | 0.734 | NA | 0.717 | 0.694 | 0.668 | 0.672 | 0.801 | 0.772 | 0.660 |
| 1994 | 0.654 | 0.681 | 0.663 | 0.669 | 0.666 | 0.670 | 0.687 | 0.679 | 0.682 | 0.676 | 0.668 | 0.667 |
| 1995 | 0.649 | 0.635 | 0.638 | 0.648 | 0.670 | 0.670 | 0.645 | 0.653 | 0.662 | 0.659 | 0.672 | 0.690 |
| 1996 | 0.691 | 0.705 | 0.762 | 0.835 | 0.830 | 0.756 | 0.731 | 0.764 | 0.824 | 0.869 | 0.892 | 0.878 |
| 1997 | 0.844 | 0.819 | 0.782 | 0.757 | 0.756 | 0.747 | 0.728 | 0.721 | 0.714 | 0.742 | 0.748 | 0.725 |
| 1998 | 0.671 | 0.647 | 0.631 | 0.628 | 0.623 | 0.610 | 0.599 | 0.582 | 0.596 | 0.605 | 0.602 | 0.550 |
| 1999 | 0.538 | 0.538 | 0.573 | 0.632 | 0.639 | 0.642 | 0.693 | 0.762 | 0.801 | 0.835 | 0.866 | 0.882 |
| 2000 | 0.907 | 0.987 | 1.023 | 0.997 | 1.047 | 1.065 | 1.010 | 1.037 | 1.181 | 1.191 | 1.163 | 1.123 |
| 2001 | 1.095 | 1.028 | 0.961 | 1.000 | 1.141 | 1.060 | 0.934 | 1.044 | 1.133 | 0.950 | 0.854 | 0.747 |
| 2002 | 0.699 | 0.695 | 0.805 | 0.866 | 0.865 | 0.843 | 0.866 | 0.914 | 0.982 | 1.043 | 1.019 | 1.027 |
| 2003 | 1.072 | 1.279 | 1.205 | 1.072 | 0.975 | 0.986 | 0.979 | 1.052 | 1.019 | 1.069 | 1.045 | 1.050 |
| 2004 | 1.115 | 1.131 | 1.158 | 1.204 | 1.243 | 1.219 | 1.264 | 1.377 | 1.463 | 1.665 | 1.645 | 1.495 |
| 2005 | 1.467 | 1.529 | 1.707 | 1.782 | 1.693 | 1.815 | 1.875 | 2.007 | 2.270 | NA | 2.181 | 2.018 |
| 2006 | 1.961 | 1.953 | 2.039 | 2.267 | 2.389 | 2.393 | 2.480 | 2.579 | 2.206 | 2.035 | 2.121 | 2.111 |
| 2007 | 1.953 | 2.017 | 2.207 | 2.355 | 2.338 | 2.360 | 2.445 | 2.438 | 2.566 | 2.630 | 2.929 | 2.838 |
| 2008 | 2.797 | 2.914 | 3.367 | 3.536 | 3.894 | 4.052 | 4.042 | 3.613 | 3.444 | 2.936 | 2.252 | 1.869 |
| 2009 | 1.772 | 1.586 | 1.489 | 1.628 | 1.681 | 2.048 | 2.006 | 2.112 | 2.092 | 2.176 | 2.253 | 2.241 |
| 2010 | 2.298 | 2.250 | 2.365 | 2.510 | 2.444 | 2.349 | 2.329 | 2.374 | 2.405 | 2.537 | 2.624 | 2.762 |
| 2011 | 2.849 | 2.988 | - | - | - | - | - | - | - | - | - | - |
| 2012 | - | - | - | - | - | - | - | - | - | - | - | - |
| 2013 | - | - | - | - | - | - | - | - | - | - | - | - |
| 2014 | - | - | - | - | - | - | - | - | - | - | - | - |
| 2015 | - | - | - | - | - | - | - | - | - | - | - | - |
| 2016 | - | - | - | - | - | - | - | - | - | - | - | - |
| 2017 | - | - | - | - | - | - | - | - | - | - | - | - |
| 2018 | - | - | - | - | - | - | - | - | - | - | - | - |
| 2019 | - | - | - | - | - | - | - | - | - | - | - | - |
| 2020 | - | - | - | - | - | - | - | - | - | - | - | - |
| 2021 | - | - | - | - | - | - | - | - | - | - | - | - |
| 2022 | - | - | - | |||||||||
| - = No Data Reported; -- = Not Applicable; NA = Not Available; W = Withheld to avoid disclosure of individual company data. |
| Release Date: 6/1/2022 |
| Next Release Date: TBD |