|
Download Data (XLS File) |
|
||||||||
|
||||||||
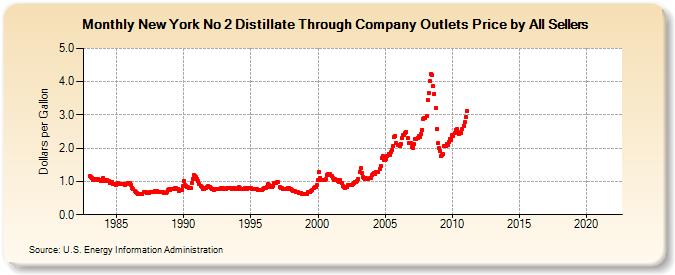
| New York No 2 Distillate Through Company Outlets Price by All Sellers (Dollars per Gallon) | ||||||||
| Year | Jan | Feb | Mar | Apr | May | Jun | Jul | Aug | Sep | Oct | Nov | Dec |
|---|---|---|---|---|---|---|---|---|---|---|---|---|
| 1983 | 1.158 | 1.127 | 1.101 | 1.052 | 1.055 | 1.082 | 1.032 | 1.074 | 1.038 | 1.045 | 1.019 | 1.015 |
| 1984 | 1.108 | 1.056 | 1.028 | 1.039 | 1.007 | 1.006 | 0.964 | 0.978 | 0.974 | 0.926 | 0.916 | 0.904 |
| 1985 | 0.935 | 0.940 | 0.924 | 0.918 | 0.915 | 0.920 | 0.921 | 0.900 | 0.912 | 0.935 | 0.954 | 0.963 |
| 1986 | 0.948 | 0.903 | 0.805 | 0.771 | 0.714 | 0.671 | 0.650 | 0.621 | 0.612 | 0.619 | 0.628 | 0.612 |
| 1987 | 0.669 | 0.672 | 0.671 | 0.659 | 0.667 | 0.666 | 0.676 | 0.685 | 0.689 | 0.696 | 0.719 | 0.711 |
| 1988 | 0.711 | 0.688 | 0.687 | 0.688 | 0.697 | 0.669 | 0.665 | 0.665 | 0.648 | 0.683 | 0.739 | 0.758 |
| 1989 | 0.734 | 0.781 | 0.761 | 0.788 | 0.789 | 0.789 | 0.776 | 0.784 | 0.721 | 0.738 | 0.743 | 0.849 |
| 1990 | 1.006 | 0.899 | 0.852 | 0.833 | 0.822 | 0.817 | 0.814 | 0.960 | 1.087 | 1.181 | 1.154 | 1.126 |
| 1991 | 1.079 | 1.007 | 0.919 | 0.850 | 0.819 | 0.788 | 0.773 | 0.798 | 0.808 | 0.822 | 0.863 | 0.843 |
| 1992 | 0.792 | 0.784 | 0.777 | 0.752 | 0.775 | 0.786 | 0.782 | 0.784 | 0.787 | 0.794 | 0.804 | 0.796 |
| 1993 | 0.788 | 0.788 | 0.786 | 0.817 | 0.803 | 0.803 | 0.791 | 0.778 | 0.783 | 0.809 | 0.797 | 0.766 |
| 1994 | 0.787 | 0.823 | 0.815 | 0.782 | 0.767 | 0.769 | 0.767 | 0.792 | 0.783 | 0.790 | 0.793 | 0.790 |
| 1995 | 0.801 | 0.780 | 0.769 | 0.771 | 0.766 | 0.764 | 0.754 | 0.748 | 0.753 | 0.751 | 0.755 | 0.776 |
| 1996 | 0.808 | 0.813 | 0.844 | 0.909 | 0.902 | 0.852 | 0.827 | 0.835 | 0.869 | 0.944 | 0.951 | 0.969 |
| 1997 | 0.969 | NA | 0.832 | 0.815 | 0.800 | 0.785 | 0.770 | 0.767 | 0.780 | 0.804 | 0.791 | 0.779 |
| 1998 | 0.759 | 0.730 | 0.703 | 0.699 | 0.693 | 0.678 | 0.668 | 0.653 | 0.647 | 0.647 | 0.627 | 0.623 |
| 1999 | 0.620 | 0.612 | 0.631 | 0.675 | 0.681 | 0.679 | 0.715 | 0.747 | 0.797 | 0.823 | 0.844 | 0.886 |
| 2000 | 1.046 | 1.296 | 1.114 | 1.046 | 1.054 | 1.037 | 1.044 | 1.072 | 1.203 | 1.210 | 1.208 | 1.213 |
| 2001 | 1.170 | 1.111 | 1.034 | 1.065 | 1.057 | 1.039 | 1.002 | 0.992 | 1.035 | 0.947 | 0.871 | 0.825 |
| 2002 | 0.818 | 0.828 | 0.840 | 0.887 | 0.898 | 0.892 | 0.895 | 0.920 | 0.963 | 0.990 | 0.984 | 1.007 |
| 2003 | 1.078 | 1.289 | 1.394 | 1.248 | 1.147 | 1.091 | 1.081 | 1.095 | 1.087 | 1.088 | 1.092 | 1.117 |
| 2004 | 1.200 | 1.235 | 1.242 | 1.236 | 1.277 | 1.275 | 1.291 | 1.368 | 1.470 | 1.707 | 1.751 | 1.649 |
| 2005 | 1.640 | 1.662 | 1.765 | 1.839 | 1.792 | 1.882 | 1.958 | 2.052 | 2.332 | 2.369 | 2.163 | 2.085 |
| 2006 | 2.095 | 2.069 | 2.135 | 2.303 | 2.401 | 2.405 | 2.442 | 2.494 | 2.296 | 2.141 | 2.145 | 2.170 |
| 2007 | 2.021 | 2.020 | 2.124 | 2.265 | 2.289 | 2.320 | 2.355 | 2.329 | 2.437 | 2.558 | 2.876 | 2.911 |
| 2008 | 2.900 | 2.955 | 3.457 | 3.665 | 4.017 | 4.243 | 4.206 | 3.867 | 3.633 | 3.206 | 2.571 | 2.147 |
| 2009 | 2.009 | 1.903 | 1.780 | 1.802 | 1.811 | 2.060 | 2.052 | 2.129 | 2.105 | 2.177 | 2.279 | 2.257 |
| 2010 | 2.396 | 2.364 | 2.455 | 2.561 | 2.562 | 2.473 | 2.433 | 2.462 | 2.456 | 2.591 | 2.677 | 2.781 |
| 2011 | 2.936 | 3.125 | - | - | - | - | - | - | - | - | - | - |
| 2012 | - | - | - | - | - | - | - | - | - | - | - | - |
| 2013 | - | - | - | - | - | - | - | - | - | - | - | - |
| 2014 | - | - | - | - | - | - | - | - | - | - | - | - |
| 2015 | - | - | - | - | - | - | - | - | - | - | - | - |
| 2016 | - | - | - | - | - | - | - | - | - | - | - | - |
| 2017 | - | - | - | - | - | - | - | - | - | - | - | - |
| 2018 | - | - | - | - | - | - | - | - | - | - | - | - |
| 2019 | - | - | - | - | - | - | - | - | - | - | - | - |
| 2020 | - | - | - | - | - | - | - | - | - | - | - | - |
| 2021 | - | - | - | - | - | - | - | - | - | - | - | - |
| 2022 | - | - | - | |||||||||
| - = No Data Reported; -- = Not Applicable; NA = Not Available; W = Withheld to avoid disclosure of individual company data. |
| Release Date: 6/1/2022 |
| Next Release Date: TBD |