|
Download Data (XLS File) |
|
||||||||
|
||||||||
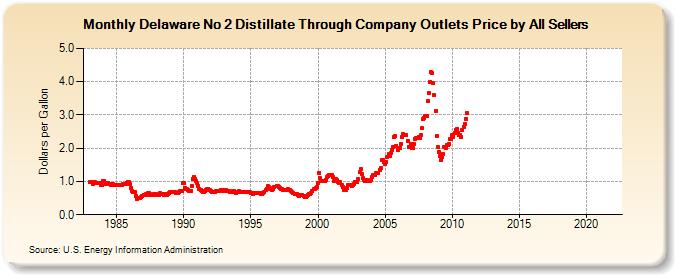
| Delaware No 2 Distillate Through Company Outlets Price by All Sellers (Dollars per Gallon) | ||||||||
| Year | Jan | Feb | Mar | Apr | May | Jun | Jul | Aug | Sep | Oct | Nov | Dec |
|---|---|---|---|---|---|---|---|---|---|---|---|---|
| 1983 | 0.983 | 0.975 | 0.972 | 0.928 | 0.957 | 0.974 | 0.966 | 0.966 | 0.956 | 0.967 | 0.898 | 0.889 |
| 1984 | 0.999 | 1.014 | 0.935 | 0.939 | 0.939 | 0.927 | 0.910 | 0.891 | 0.897 | 0.910 | 0.901 | 0.882 |
| 1985 | 0.886 | 0.884 | 0.898 | 0.908 | 0.885 | 0.882 | 0.914 | 0.910 | 0.924 | 0.962 | 0.985 | 0.988 |
| 1986 | 0.918 | 0.803 | 0.716 | 0.673 | 0.679 | 0.577 | 0.465 | 0.507 | 0.507 | 0.510 | 0.523 | 0.551 |
| 1987 | 0.602 | 0.601 | 0.608 | 0.603 | 0.642 | 0.640 | 0.616 | 0.581 | 0.591 | 0.624 | 0.637 | 0.619 |
| 1988 | 0.607 | 0.599 | 0.599 | 0.642 | 0.625 | 0.616 | 0.607 | 0.620 | 0.597 | 0.595 | 0.625 | 0.648 |
| 1989 | 0.676 | 0.674 | 0.686 | 0.690 | 0.669 | 0.653 | 0.644 | 0.642 | 0.672 | 0.701 | 0.708 | 0.949 |
| 1990 | 0.950 | 0.810 | 0.759 | 0.760 | 0.738 | 0.711 | 0.727 | 0.878 | 1.067 | 1.142 | 1.084 | 1.015 |
| 1991 | 0.943 | 0.864 | 0.780 | 0.731 | 0.700 | 0.675 | 0.686 | 0.710 | 0.740 | 0.761 | 0.782 | 0.754 |
| 1992 | 0.708 | 0.690 | 0.677 | 0.689 | 0.697 | 0.720 | 0.713 | 0.711 | 0.725 | 0.757 | 0.751 | 0.733 |
| 1993 | 0.719 | 0.720 | 0.728 | 0.703 | 0.702 | 0.695 | 0.686 | 0.687 | 0.714 | 0.700 | 0.684 | 0.657 |
| 1994 | 0.671 | 0.705 | 0.694 | 0.687 | 0.688 | 0.682 | 0.686 | 0.679 | 0.676 | 0.671 | 0.681 | 0.668 |
| 1995 | 0.653 | 0.642 | 0.637 | 0.645 | 0.651 | 0.649 | 0.643 | 0.641 | 0.644 | 0.637 | 0.637 | 0.659 |
| 1996 | 0.695 | 0.728 | 0.782 | 0.852 | 0.833 | 0.799 | 0.769 | 0.747 | 0.783 | 0.841 | NA | 0.863 |
| 1997 | 0.860 | 0.836 | 0.816 | 0.767 | 0.760 | 0.748 | 0.733 | 0.742 | 0.739 | 0.760 | 0.744 | 0.732 |
| 1998 | 0.710 | 0.675 | 0.645 | 0.635 | 0.631 | 0.612 | 0.588 | 0.572 | 0.578 | 0.596 | 0.584 | 0.548 |
| 1999 | 0.547 | 0.529 | 0.554 | 0.598 | 0.621 | 0.613 | 0.655 | 0.702 | 0.762 | 0.784 | 0.805 | 0.840 |
| 2000 | 0.950 | 1.267 | 1.091 | 1.000 | 1.017 | 1.001 | 1.013 | 1.037 | 1.144 | 1.157 | 1.189 | 1.208 |
| 2001 | 1.188 | 1.128 | 1.018 | 1.044 | 1.062 | 1.037 | 0.989 | 0.957 | 0.974 | 0.905 | 0.823 | 0.749 |
| 2002 | 0.736 | 0.732 | 0.803 | 0.895 | 0.898 | 0.881 | 0.875 | 0.881 | 0.936 | 0.979 | 0.974 | 0.983 |
| 2003 | 1.059 | 1.276 | 1.371 | 1.217 | 1.096 | 1.036 | 1.023 | 1.041 | 1.030 | 1.022 | 1.022 | 1.040 |
| 2004 | 1.121 | 1.179 | 1.197 | 1.196 | 1.239 | 1.265 | 1.268 | 1.348 | 1.392 | 1.631 | 1.655 | 1.579 |
| 2005 | 1.533 | 1.587 | 1.729 | 1.817 | 1.773 | 1.843 | 1.959 | 2.023 | 2.328 | 2.352 | 2.075 | 1.959 |
| 2006 | 2.018 | 2.016 | 2.117 | 2.329 | 2.414 | 2.411 | 2.396 | 2.387 | 2.225 | 2.040 | 2.037 | 2.121 |
| 2007 | 1.994 | 2.003 | 2.121 | 2.287 | 2.305 | 2.317 | 2.341 | 2.303 | 2.398 | 2.599 | 2.866 | 2.911 |
| 2008 | 2.975 | 2.963 | 3.417 | 3.657 | 3.985 | 4.286 | 4.261 | 3.945 | 3.592 | 3.126 | 2.380 | 2.035 |
| 2009 | 1.873 | 1.761 | 1.635 | 1.750 | 1.818 | 2.034 | 2.015 | 2.103 | 2.086 | 2.123 | 2.266 | 2.278 |
| 2010 | 2.386 | 2.345 | 2.468 | 2.547 | 2.578 | 2.453 | 2.400 | 2.386 | 2.349 | 2.534 | 2.636 | 2.732 |
| 2011 | 2.879 | 3.043 | - | - | - | - | - | - | - | - | - | - |
| 2012 | - | - | - | - | - | - | - | - | - | - | - | - |
| 2013 | - | - | - | - | - | - | - | - | - | - | - | - |
| 2014 | - | - | - | - | - | - | - | - | - | - | - | - |
| 2015 | - | - | - | - | - | - | - | - | - | - | - | - |
| 2016 | - | - | - | - | - | - | - | - | - | - | - | - |
| 2017 | - | - | - | - | - | - | - | - | - | - | - | - |
| 2018 | - | - | - | - | - | - | - | - | - | - | - | - |
| 2019 | - | - | - | - | - | - | - | - | - | - | - | - |
| 2020 | - | - | - | - | - | - | - | - | - | - | - | - |
| 2021 | - | - | - | - | - | - | - | - | - | - | - | - |
| 2022 | - | - | - | |||||||||
| - = No Data Reported; -- = Not Applicable; NA = Not Available; W = Withheld to avoid disclosure of individual company data. |
| Release Date: 6/1/2022 |
| Next Release Date: TBD |