|
Download Data (XLS File) |
|
||||||||
|
||||||||
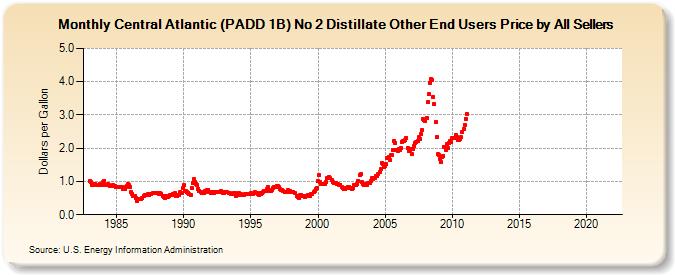
| Central Atlantic (PADD 1B) No 2 Distillate Other End Users Price by All Sellers (Dollars per Gallon) | ||||||||
| Year | Jan | Feb | Mar | Apr | May | Jun | Jul | Aug | Sep | Oct | Nov | Dec |
|---|---|---|---|---|---|---|---|---|---|---|---|---|
| 1983 | 1.009 | 0.971 | 0.894 | 0.907 | 0.919 | 0.927 | 0.886 | 0.886 | 0.897 | 0.920 | 0.915 | 0.900 |
| 1984 | 0.996 | 1.025 | 0.898 | 0.893 | 0.914 | 0.893 | 0.873 | 0.858 | 0.868 | 0.894 | 0.864 | 0.841 |
| 1985 | 0.830 | 0.828 | 0.830 | 0.845 | 0.827 | 0.819 | 0.776 | 0.771 | 0.830 | 0.873 | 0.922 | 0.895 |
| 1986 | 0.842 | 0.678 | 0.635 | 0.576 | 0.562 | 0.494 | 0.423 | 0.467 | 0.473 | 0.471 | 0.487 | 0.493 |
| 1987 | 0.576 | 0.587 | 0.586 | 0.601 | 0.619 | 0.606 | 0.614 | 0.618 | 0.639 | 0.654 | 0.660 | 0.641 |
| 1988 | 0.638 | 0.639 | 0.615 | 0.650 | 0.637 | 0.576 | 0.533 | 0.505 | 0.569 | 0.538 | 0.533 | 0.550 |
| 1989 | 0.595 | 0.581 | 0.618 | 0.636 | 0.638 | 0.556 | 0.564 | 0.579 | 0.602 | 0.672 | 0.652 | 0.800 |
| 1990 | 0.883 | 0.712 | 0.698 | 0.687 | 0.659 | 0.608 | 0.604 | 0.816 | 0.951 | 1.061 | 0.995 | 0.917 |
| 1991 | 0.887 | 0.783 | 0.722 | 0.681 | 0.658 | 0.658 | 0.649 | 0.700 | 0.695 | 0.750 | 0.753 | 0.688 |
| 1992 | 0.640 | 0.650 | 0.678 | 0.660 | 0.674 | 0.692 | 0.681 | 0.676 | 0.692 | 0.720 | 0.684 | 0.663 |
| 1993 | 0.651 | 0.672 | 0.685 | 0.669 | 0.660 | 0.644 | 0.618 | 0.610 | 0.627 | 0.667 | 0.646 | 0.573 |
| 1994 | 0.596 | 0.662 | 0.619 | 0.610 | 0.600 | 0.599 | 0.600 | 0.612 | 0.608 | 0.629 | 0.632 | 0.623 |
| 1995 | 0.638 | 0.627 | 0.628 | 0.643 | 0.673 | 0.653 | 0.626 | 0.607 | 0.659 | 0.634 | 0.655 | 0.692 |
| 1996 | 0.706 | 0.716 | 0.769 | 0.820 | 0.746 | 0.699 | 0.705 | 0.749 | 0.800 | 0.838 | 0.841 | 0.868 |
| 1997 | 0.855 | 0.821 | 0.769 | 0.754 | 0.753 | 0.710 | 0.669 | 0.685 | 0.680 | 0.744 | 0.722 | 0.713 |
| 1998 | 0.697 | 0.697 | 0.676 | 0.663 | NA | 0.572 | 0.544 | 0.515 | 0.585 | 0.598 | 0.568 | 0.556 |
| 1999 | 0.545 | 0.554 | 0.573 | 0.587 | 0.586 | 0.565 | 0.611 | 0.627 | 0.690 | 0.708 | 0.771 | 0.817 |
| 2000 | 0.999 | 1.179 | 0.982 | 0.931 | 0.924 | 0.911 | 0.937 | 0.981 | 1.096 | 1.105 | 1.141 | 1.092 |
| 2001 | 1.047 | 0.986 | 0.962 | 0.956 | 0.968 | 0.929 | 0.909 | 0.902 | 0.905 | 0.840 | 0.803 | 0.772 |
| 2002 | 0.772 | 0.792 | 0.802 | 0.833 | 0.825 | 0.789 | 0.781 | 0.806 | 0.894 | 0.907 | 0.883 | 0.918 |
| 2003 | 1.017 | 1.196 | 1.214 | 0.978 | 0.938 | 0.885 | 0.919 | 0.932 | 0.902 | 0.957 | 0.943 | 1.004 |
| 2004 | 1.097 | 1.061 | 1.098 | 1.109 | 1.172 | 1.160 | 1.224 | 1.282 | 1.364 | 1.551 | 1.512 | 1.448 |
| 2005 | 1.474 | 1.511 | 1.706 | 1.729 | 1.657 | 1.786 | 1.783 | 1.942 | 2.202 | 2.170 | 1.955 | 1.922 |
| 2006 | 1.973 | 1.950 | 2.008 | 2.197 | 2.220 | 2.215 | 2.237 | 2.314 | 1.999 | 1.927 | 1.954 | 1.983 |
| 2007 | 1.836 | 1.976 | 2.076 | 2.161 | 2.190 | 2.226 | 2.326 | 2.284 | 2.412 | 2.554 | 2.867 | 2.847 |
| 2008 | 2.810 | 2.913 | 3.381 | 3.619 | 3.972 | 4.087 | 4.057 | 3.544 | 3.323 | 2.785 | 2.328 | 1.814 |
| 2009 | 1.789 | 1.677 | 1.577 | 1.720 | 1.771 | 2.022 | 1.949 | 2.113 | 2.020 | 2.161 | 2.207 | 2.182 |
| 2010 | 2.308 | NA | 2.306 | 2.401 | 2.330 | 2.242 | 2.232 | 2.285 | 2.332 | 2.475 | 2.580 | 2.711 |
| 2011 | 2.888 | 3.028 | - | - | - | - | - | - | - | - | - | - |
| 2012 | - | - | - | - | - | - | - | - | - | - | - | - |
| 2013 | - | - | - | - | - | - | - | - | - | - | - | - |
| 2014 | - | - | - | - | - | - | - | - | - | - | - | - |
| 2015 | - | - | - | - | - | - | - | - | - | - | - | - |
| 2016 | - | - | - | - | - | - | - | - | - | - | - | - |
| 2017 | - | - | - | - | - | - | - | - | - | - | - | - |
| 2018 | - | - | - | - | - | - | - | - | - | - | - | - |
| 2019 | - | - | - | - | - | - | - | - | - | - | - | - |
| 2020 | - | - | - | - | - | - | - | - | - | - | - | - |
| 2021 | - | - | - | - | - | - | - | - | - | - | - | - |
| 2022 | - | - | - | |||||||||
| - = No Data Reported; -- = Not Applicable; NA = Not Available; W = Withheld to avoid disclosure of individual company data. |
| Release Date: 6/1/2022 |
| Next Release Date: TBD |