|
Download Data (XLS File) |
|
||||||||
|
||||||||
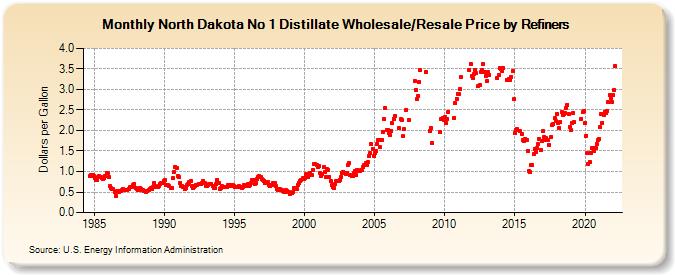
| North Dakota No 1 Distillate Wholesale/Resale Price by Refiners (Dollars per Gallon) | ||||||||
| Year | Jan | Feb | Mar | Apr | May | Jun | Jul | Aug | Sep | Oct | Nov | Dec |
|---|---|---|---|---|---|---|---|---|---|---|---|---|
| 1984 | 0.881 | 0.905 | 0.906 | 0.885 | ||||||||
| 1985 | 0.837 | 0.800 | 0.802 | 0.863 | 0.890 | 0.869 | 0.846 | 0.829 | 0.846 | 0.890 | 0.960 | 0.976 |
| 1986 | 0.856 | 0.638 | 0.591 | 0.582 | 0.567 | 0.513 | 0.415 | 0.514 | 0.532 | 0.509 | 0.530 | 0.538 |
| 1987 | 0.571 | 0.549 | 0.547 | 0.555 | 0.555 | 0.580 | 0.613 | 0.633 | 0.632 | 0.681 | 0.704 | 0.609 |
| 1988 | 0.568 | 0.542 | 0.539 | 0.602 | 0.585 | 0.548 | 0.520 | 0.518 | 0.512 | 0.519 | 0.549 | 0.568 |
| 1989 | 0.598 | 0.563 | 0.619 | 0.716 | 0.652 | 0.624 | 0.633 | 0.648 | 0.699 | 0.722 | 0.729 | 0.780 |
| 1990 | 0.794 | 0.664 | 0.675 | 0.661 | 0.638 | 0.589 | 0.603 | 0.841 | 0.978 | 1.119 | 1.080 | 0.887 |
| 1991 | 0.861 | 0.726 | 0.651 | 0.647 | 0.629 | 0.571 | 0.610 | 0.673 | 0.697 | 0.748 | 0.772 | 0.646 |
| 1992 | 0.591 | 0.631 | 0.643 | 0.665 | 0.681 | 0.707 | 0.702 | 0.693 | 0.720 | 0.766 | 0.713 | 0.651 |
| 1993 | 0.654 | 0.674 | 0.691 | 0.689 | 0.689 | 0.651 | 0.604 | 0.610 | 0.696 | 0.796 | 0.713 | 0.580 |
| 1994 | 0.609 | 0.640 | 0.617 | 0.633 | 0.621 | 0.631 | 0.663 | 0.669 | 0.651 | 0.665 | 0.662 | 0.641 |
| 1995 | 0.620 | 0.611 | 0.617 | 0.634 | 0.641 | 0.614 | 0.606 | 0.632 | 0.666 | 0.643 | 0.664 | 0.692 |
| 1996 | 0.656 | 0.682 | 0.718 | 0.784 | 0.784 | 0.684 | 0.715 | 0.806 | 0.865 | 0.886 | 0.862 | 0.812 |
| 1997 | 0.796 | 0.779 | 0.716 | 0.714 | 0.752 | 0.676 | 0.643 | 0.670 | 0.663 | 0.726 | 0.720 | 0.640 |
| 1998 | 0.563 | 0.554 | 0.541 | 0.570 | 0.546 | 0.516 | 0.505 | 0.497 | 0.541 | 0.531 | 0.503 | 0.447 |
| 1999 | 0.481 | 0.467 | 0.495 | 0.610 | 0.575 | 0.584 | 0.664 | 0.722 | 0.777 | 0.802 | 0.834 | 0.826 |
| 2000 | 0.854 | 0.933 | 0.917 | 0.864 | 0.967 | 0.924 | 0.903 | 1.046 | 1.171 | 1.176 | 1.163 | 1.100 |
| 2001 | 1.129 | 0.967 | 0.902 | 0.951 | 1.116 | 0.981 | 0.856 | 1.055 | 1.042 | 0.867 | 0.759 | 0.663 |
| 2002 | 0.625 | 0.608 | 0.689 | 0.770 | 0.757 | 0.765 | 0.805 | 0.868 | 0.973 | 0.995 | 0.974 | 0.951 |
| 2003 | 0.970 | 1.159 | 1.197 | 0.922 | 0.889 | 0.901 | 0.954 | 1.002 | 0.916 | 1.035 | 1.017 | 1.005 |
| 2004 | 1.035 | 1.025 | 1.104 | 1.152 | 1.203 | 1.159 | 1.229 | 1.366 | 1.442 | 1.664 | 1.559 | 1.375 |
| 2005 | 1.452 | 1.502 | 1.668 | 1.772 | 1.594 | 1.762 | 1.777 | 1.970 | 2.272 | 2.549 | 2.011 | 2.015 |
| 2006 | 1.950 | 1.891 | 1.991 | 2.173 | 2.285 | 2.348 | W | W | W | 2.053 | 2.272 | 2.246 |
| 2007 | 1.865 | 2.026 | W | 2.501 | W | 2.249 | W | W | - | W | 3.208 | 2.997 |
| 2008 | 2.757 | 2.852 | 3.185 | 3.464 | W | W | W | W | 3.426 | W | W | 1.984 |
| 2009 | 2.061 | 1.690 | W | W | W | W | W | W | 1.957 | 2.272 | 2.298 | 2.261 |
| 2010 | 2.335 | 2.183 | 2.279 | 2.459 | W | W | W | W | 2.307 | 2.659 | 2.775 | 2.898 |
| 2011 | 2.886 | 3.003 | 3.301 | - | W | - | W | W | W | 3.469 | 3.620 | 3.327 |
| 2012 | 3.268 | 3.376 | 3.478 | 3.392 | 3.076 | W | 3.116 | 3.431 | 3.468 | 3.617 | 3.416 | 3.332 |
| 2013 | 3.211 | 3.429 | 3.349 | W | W | W | W | W | W | 3.273 | 3.344 | 3.515 |
| 2014 | 3.507 | 3.442 | 3.517 | W | W | 3.238 | 3.240 | 3.257 | 3.228 | 3.306 | 3.441 | 2.757 |
| 2015 | 1.931 | 2.013 | 2.028 | NA | 1.994 | W | 1.915 | 1.769 | 1.745 | 1.804 | 1.775 | 1.511 |
| 2016 | 1.010 | 0.981 | 1.150 | 1.157 | 1.426 | 1.560 | 1.473 | 1.578 | 1.662 | 1.803 | 1.530 | 1.746 |
| 2017 | 1.981 | 1.844 | 1.762 | 1.806 | 1.774 | 1.658 | W | 1.839 | 2.132 | 2.163 | 2.306 | 2.222 |
| 2018 | 2.403 | 2.185 | 2.056 | 2.203 | 2.446 | 2.388 | 2.390 | 2.423 | 2.555 | 2.628 | 2.407 | 2.092 |
| 2019 | 2.015 | 2.181 | 2.434 | 2.206 | W | W | W | W | W | 2.286 | 2.441 | 2.475 |
| 2020 | 2.192 | 1.873 | 1.445 | 1.180 | 1.233 | 1.458 | 1.583 | 1.572 | 1.508 | 1.576 | 1.670 | 1.761 |
| 2021 | 1.795 | 2.073 | 2.412 | 2.193 | 2.387 | 2.453 | 2.435 | 2.484 | 2.687 | 2.854 | 2.795 | 2.703 |
| 2022 | 2.854 | 2.984 | 3.569 | |||||||||
| - = No Data Reported; -- = Not Applicable; NA = Not Available; W = Withheld to avoid disclosure of individual company data. |
| Release Date: 6/1/2022 |
| Next Release Date: TBD |