|
Download Data (XLS File) |
|
||||||||||||
|
||||||||||||
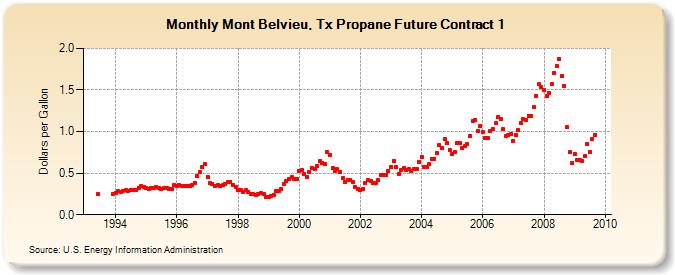
| Mont Belvieu, Tx Propane Future Contract 1 (Dollars per Gallon) | ||||||||||||
| Year | Jan | Feb | Mar | Apr | May | Jun | Jul | Aug | Sep | Oct | Nov | Dec |
|---|---|---|---|---|---|---|---|---|---|---|---|---|
| 1993 | 0.253 | 0.253 | ||||||||||
| 1994 | 0.264 | 0.282 | 0.278 | 0.289 | 0.297 | 0.290 | 0.295 | 0.302 | 0.303 | 0.326 | 0.347 | 0.337 |
| 1995 | 0.325 | 0.312 | 0.320 | 0.322 | 0.329 | 0.322 | 0.311 | 0.316 | 0.316 | 0.311 | 0.312 | 0.360 |
| 1996 | 0.345 | 0.354 | 0.346 | 0.349 | 0.344 | 0.350 | 0.356 | 0.383 | 0.464 | 0.513 | 0.571 | 0.607 |
| 1997 | 0.457 | 0.378 | 0.373 | 0.348 | 0.356 | 0.346 | 0.352 | 0.372 | 0.389 | 0.398 | 0.359 | 0.337 |
| 1998 | 0.298 | 0.295 | 0.274 | 0.293 | 0.277 | 0.248 | 0.249 | 0.243 | 0.251 | 0.260 | 0.248 | 0.214 |
| 1999 | 0.217 | 0.224 | 0.242 | 0.282 | 0.284 | 0.312 | 0.373 | 0.406 | 0.433 | 0.451 | 0.432 | 0.426 |
| 2000 | 0.520 | 0.536 | 0.488 | 0.458 | 0.515 | 0.559 | 0.553 | 0.588 | 0.644 | 0.622 | 0.611 | 0.753 |
| 2001 | 0.714 | 0.564 | 0.528 | 0.545 | 0.516 | 0.437 | 0.395 | 0.420 | 0.415 | 0.396 | 0.331 | 0.307 |
| 2002 | 0.292 | 0.312 | 0.379 | 0.414 | 0.407 | 0.378 | 0.376 | 0.418 | 0.472 | 0.480 | 0.474 | 0.527 |
| 2003 | 0.577 | 0.649 | 0.568 | 0.494 | 0.537 | 0.560 | 0.532 | 0.552 | 0.522 | 0.555 | 0.547 | 0.628 |
| 2004 | 0.692 | 0.577 | 0.577 | 0.607 | 0.675 | 0.671 | 0.743 | 0.837 | 0.801 | 0.905 | 0.862 | 0.781 |
| 2005 | 0.732 | 0.751 | 0.862 | 0.857 | 0.798 | 0.822 | 0.849 | 0.945 | 1.130 | 1.139 | 1.006 | 1.066 |
| 2006 | 0.990 | 0.918 | 0.921 | 1.008 | 1.035 | 1.097 | 1.172 | 1.145 | 1.026 | 0.947 | 0.955 | 0.972 |
| 2007 | 0.889 | 0.960 | 1.018 | 1.099 | 1.146 | 1.143 | 1.193 | 1.190 | 1.295 | 1.431 | 1.566 | 1.533 |
| 2008 | 1.500 | 1.423 | 1.465 | 1.567 | 1.708 | 1.791 | 1.868 | 1.666 | 1.549 | 1.050 | 0.749 | 0.619 |
| 2009 | 0.728 | 0.658 | 0.659 | 0.645 | 0.710 | 0.847 | 0.757 | 0.915 | 0.962 | |||
| - = No Data Reported; -- = Not Applicable; NA = Not Available; W = Withheld to avoid disclosure of individual company data. |
| Release Date: 4/24/2024 |
| Next Release Date: 5/1/2024 |
Referring Pages: