|
Download Data (XLS File) |
|
||||||||||||
|
||||||||||||
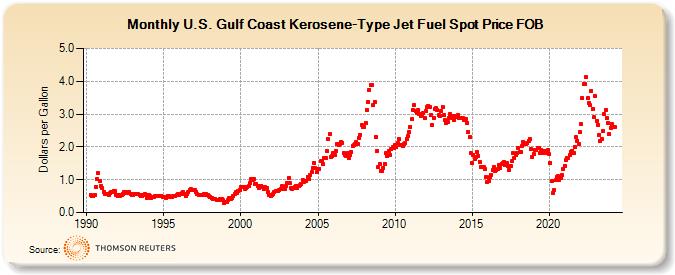
| U.S. Gulf Coast Kerosene-Type Jet Fuel Spot Price FOB (Dollars per Gallon) | ||||||||||||
| Year | Jan | Feb | Mar | Apr | May | Jun | Jul | Aug | Sep | Oct | Nov | Dec |
|---|---|---|---|---|---|---|---|---|---|---|---|---|
| 1990 | 0.540 | 0.515 | 0.494 | 0.535 | 0.791 | 1.012 | 1.196 | 0.971 | 0.803 | |||
| 1991 | 0.741 | 0.637 | 0.558 | 0.552 | 0.569 | 0.547 | 0.586 | 0.623 | 0.635 | 0.671 | 0.645 | 0.522 |
| 1992 | 0.509 | 0.543 | 0.514 | 0.543 | 0.579 | 0.615 | 0.611 | 0.590 | 0.623 | 0.621 | 0.561 | 0.544 |
| 1993 | 0.534 | 0.553 | 0.558 | 0.551 | 0.553 | 0.526 | 0.494 | 0.501 | 0.535 | 0.568 | 0.533 | 0.446 |
| 1994 | 0.528 | 0.501 | 0.451 | 0.469 | 0.472 | 0.493 | 0.509 | 0.498 | 0.490 | 0.509 | 0.513 | 0.487 |
| 1995 | 0.472 | 0.467 | 0.449 | 0.500 | 0.511 | 0.478 | 0.467 | 0.496 | 0.513 | 0.502 | 0.524 | 0.553 |
| 1996 | 0.550 | 0.557 | 0.586 | 0.617 | 0.557 | 0.516 | 0.556 | 0.615 | 0.682 | 0.703 | 0.696 | 0.693 |
| 1997 | 0.680 | 0.619 | 0.557 | 0.541 | 0.549 | 0.523 | 0.536 | 0.559 | 0.541 | 0.571 | 0.549 | 0.496 |
| 1998 | 0.476 | 0.449 | 0.413 | 0.426 | 0.416 | 0.389 | 0.386 | 0.372 | 0.420 | 0.420 | 0.371 | 0.304 |
| 1999 | 0.334 | 0.309 | 0.378 | 0.430 | 0.415 | 0.440 | 0.512 | 0.564 | 0.614 | 0.595 | 0.661 | 0.701 |
| 2000 | 0.781 | 0.780 | 0.771 | 0.719 | 0.762 | 0.785 | 0.796 | 0.900 | 1.017 | 0.982 | 1.028 | 0.863 |
| 2001 | 0.870 | 0.815 | 0.748 | 0.770 | 0.821 | 0.767 | 0.711 | 0.764 | 0.738 | 0.622 | 0.543 | 0.515 |
| 2002 | 0.533 | 0.551 | 0.630 | 0.669 | 0.666 | 0.653 | 0.691 | 0.722 | 0.800 | 0.790 | 0.708 | 0.811 |
| 2003 | 0.887 | 1.055 | 0.893 | 0.743 | 0.714 | 0.748 | 0.780 | 0.823 | 0.738 | 0.820 | 0.831 | 0.876 |
| 2004 | 0.998 | 0.933 | 0.947 | 0.973 | 1.092 | 1.032 | 1.145 | 1.227 | 1.362 | 1.520 | 1.347 | 1.223 |
| 2005 | 1.334 | 1.334 | 1.562 | 1.573 | 1.471 | 1.654 | 1.665 | 1.874 | 2.232 | 2.398 | 1.698 | 1.727 |
| 2006 | 1.816 | 1.754 | 1.875 | 2.074 | 2.070 | 2.081 | 2.154 | 2.133 | 1.810 | 1.739 | 1.733 | 1.810 |
| 2007 | 1.654 | 1.740 | 1.846 | 2.036 | 2.044 | 2.099 | 2.137 | 2.092 | 2.265 | 2.372 | 2.673 | 2.601 |
| 2008 | 2.605 | 2.728 | 3.124 | 3.365 | 3.738 | 3.878 | 3.886 | 3.271 | 3.375 | 2.315 | 1.880 | 1.375 |
| 2009 | 1.469 | 1.259 | 1.268 | 1.369 | 1.488 | 1.805 | 1.712 | 1.885 | 1.749 | 1.942 | 1.986 | 1.979 |
| 2010 | 2.052 | 1.989 | 2.108 | 2.243 | 2.063 | 2.058 | 2.019 | 2.083 | 2.114 | 2.248 | 2.323 | 2.453 |
| 2011 | 2.619 | 2.839 | 3.125 | 3.267 | 3.085 | 3.046 | 3.131 | 3.008 | 2.948 | 2.966 | 3.046 | 2.873 |
| 2012 | 3.087 | 3.207 | 3.256 | 3.226 | 2.974 | 2.678 | 2.892 | 3.156 | 3.191 | 3.111 | 2.960 | 2.940 |
| 2013 | 3.091 | 3.218 | 2.969 | 2.808 | 2.725 | 2.769 | 2.894 | 3.003 | 2.934 | 2.885 | 2.830 | 2.955 |
| 2014 | 2.921 | 2.965 | 2.890 | 2.888 | 2.868 | 2.883 | 2.817 | 2.839 | 2.729 | 2.460 | 2.297 | 1.801 |
| 2015 | 1.496 | 1.766 | 1.629 | 1.702 | 1.849 | 1.732 | 1.549 | 1.389 | 1.395 | 1.391 | 1.326 | 1.082 |
| 2016 | 0.930 | 0.973 | 1.069 | 1.147 | 1.299 | 1.382 | 1.272 | 1.295 | 1.319 | 1.457 | 1.356 | 1.491 |
| 2017 | 1.514 | 1.547 | 1.445 | 1.510 | 1.412 | 1.295 | 1.417 | 1.561 | 1.800 | 1.659 | 1.760 | 1.817 |
| 2018 | 1.952 | 1.849 | 1.858 | 2.015 | 2.155 | 2.090 | 2.098 | 2.118 | 2.189 | 2.249 | 1.945 | 1.696 |
| 2019 | 1.784 | 1.914 | 1.902 | 1.977 | 1.972 | 1.817 | 1.913 | 1.800 | 1.874 | 1.861 | 1.824 | 1.893 |
| 2020 | 1.770 | 1.509 | 0.953 | 0.606 | 0.686 | 0.983 | 1.084 | 1.112 | 1.006 | 1.047 | 1.133 | 1.324 |
| 2021 | 1.420 | 1.601 | 1.661 | 1.669 | 1.752 | 1.857 | 1.887 | 1.817 | 2.003 | 2.296 | 2.193 | 2.095 |
| 2022 | 2.446 | 2.682 | 3.495 | 3.914 | 3.902 | 4.120 | 3.478 | 3.339 | 3.262 | 3.715 | 3.160 | 2.897 |
| 2023 | 3.542 | 2.790 | 2.679 | 2.374 | 2.173 | 2.250 | 2.488 | 2.989 | 3.120 | 2.881 | 2.734 | 2.387 |
| 2024 | 2.585 | 2.683 | 2.593 | |||||||||
| - = No Data Reported; -- = Not Applicable; NA = Not Available; W = Withheld to avoid disclosure of individual company data. |
| Release Date: 4/17/2024 |
| Next Release Date: 4/24/2024 |
Referring Pages: