|
Download Data (XLS File) |
|
||||||||
|
||||||||
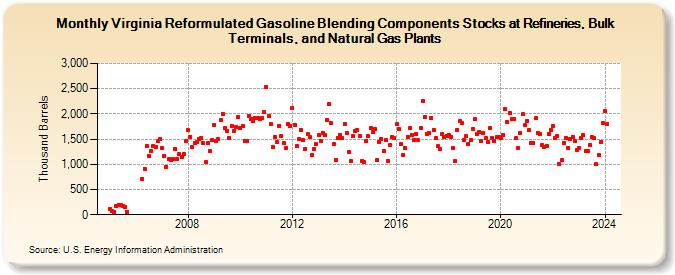
| Virginia Reformulated Gasoline Blending Components Stocks at Refineries, Bulk Terminals, and Natural Gas Plants (Thousand Barrels) | ||||||||
| Year | Jan | Feb | Mar | Apr | May | Jun | Jul | Aug | Sep | Oct | Nov | Dec |
|---|---|---|---|---|---|---|---|---|---|---|---|---|
| 2005 | 119 | 77 | 59 | 176 | 193 | 183 | 182 | 151 | 59 | |||
| 2006 | 709 | 912 | 1,363 | 1,167 | 1,263 | 1,368 | 1,337 | 1,457 | 1,498 | |||
| 2007 | 1,326 | 1,174 | 949 | 1,097 | 1,093 | 1,097 | 1,310 | 1,106 | 1,209 | 1,139 | 1,209 | 1,456 |
| 2008 | 1,674 | 1,549 | 1,334 | 1,428 | 1,441 | 1,511 | 1,516 | 1,415 | 1,039 | 1,424 | 1,261 | 1,480 |
| 2009 | 1,770 | 1,469 | 1,504 | 1,871 | 2,007 | 1,718 | 1,660 | 1,526 | 1,768 | 1,667 | 1,740 | 1,939 |
| 2010 | 1,719 | 1,754 | 1,472 | 1,471 | 1,966 | 1,908 | 1,851 | 1,917 | 1,924 | 1,902 | 1,921 | 2,028 |
| 2011 | 2,535 | 1,958 | 1,795 | 1,348 | 1,547 | 1,443 | 1,765 | 1,552 | 1,427 | 1,320 | 1,801 | 1,752 |
| 2012 | 2,114 | 1,778 | 1,366 | 1,510 | 1,690 | 1,480 | 1,312 | 1,592 | 1,539 | 1,183 | 1,313 | 1,408 |
| 2013 | 1,573 | 1,466 | 1,629 | 1,574 | 1,872 | 2,191 | 1,819 | 1,409 | 1,082 | 1,521 | 1,575 | 1,513 |
| 2014 | 1,809 | 1,624 | 1,246 | 1,060 | 1,565 | 1,655 | 1,686 | 1,566 | 1,066 | 1,039 | 1,453 | 1,555 |
| 2015 | 1,725 | 1,642 | 1,709 | 1,080 | 1,449 | 1,497 | 1,257 | 1,481 | 1,065 | 1,384 | 1,535 | 1,519 |
| 2016 | 1,794 | 1,704 | 1,406 | 1,193 | 1,321 | 1,549 | 1,714 | 1,578 | 1,489 | 1,597 | 1,475 | 1,725 |
| 2017 | 2,254 | 1,944 | 1,610 | 1,621 | 1,921 | 1,686 | 1,516 | 1,362 | 1,298 | 1,602 | 1,539 | 1,569 |
| 2018 | 1,589 | 1,547 | 1,320 | 1,057 | 1,690 | 1,858 | 1,825 | 1,488 | 1,552 | 1,398 | 1,476 | 1,698 |
| 2019 | 1,902 | 1,604 | 1,645 | 1,463 | 1,618 | 1,512 | 1,439 | 1,715 | 1,519 | 1,466 | 1,535 | 1,551 |
| 2020 | 1,520 | 1,591 | 2,093 | 1,834 | 2,024 | 1,901 | 1,900 | 1,514 | 1,327 | 1,621 | 1,990 | 1,773 |
| 2021 | 1,864 | 1,683 | 1,418 | 1,432 | 1,912 | 1,630 | 1,601 | 1,389 | 1,346 | 1,369 | 1,603 | 1,676 |
| 2022 | 1,759 | 1,531 | 1,558 | 999 | 1,078 | 1,429 | 1,531 | 1,328 | 1,511 | 1,550 | 1,459 | 1,287 |
| 2023 | 1,325 | 1,513 | 1,575 | 1,263 | 1,272 | 1,386 | 1,533 | 1,518 | 999 | 1,179 | 1,449 | 1,823 |
| 2024 | 2,056 | |||||||||||
| - = No Data Reported; -- = Not Applicable; NA = Not Available; W = Withheld to avoid disclosure of individual company data. |
| Release Date: 3/29/2024 |
| Next Release Date: 4/30/2024 |