|
Download Data (XLS File) |
|
||||||||
|
||||||||
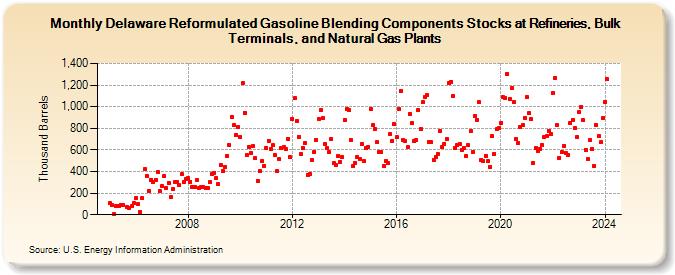
| Delaware Reformulated Gasoline Blending Components Stocks at Refineries, Bulk Terminals, and Natural Gas Plants (Thousand Barrels) | ||||||||
| Year | Jan | Feb | Mar | Apr | May | Jun | Jul | Aug | Sep | Oct | Nov | Dec |
|---|---|---|---|---|---|---|---|---|---|---|---|---|
| 2005 | 105 | 88 | 5 | 78 | 85 | 90 | 90 | 72 | 65 | 81 | 111 | |
| 2006 | 153 | 95 | 26 | 151 | 420 | 360 | 221 | 325 | 305 | 321 | 394 | 216 |
| 2007 | 263 | 354 | 246 | 294 | 160 | 242 | 299 | 303 | 272 | 374 | 300 | 327 |
| 2008 | 336 | 307 | 253 | 259 | 317 | 249 | 254 | 256 | 247 | 245 | 299 | 378 |
| 2009 | 389 | 339 | 282 | 461 | 402 | 446 | 545 | 645 | 908 | 827 | 739 | 814 |
| 2010 | 721 | 1,215 | 945 | 550 | 628 | 567 | 636 | 525 | 313 | 405 | 498 | 455 |
| 2011 | 621 | 684 | 612 | 641 | 556 | 405 | 514 | 613 | 623 | 608 | 705 | 533 |
| 2012 | 887 | 1,077 | 868 | 723 | 558 | 617 | 665 | 370 | 381 | 506 | 584 | 692 |
| 2013 | 885 | 970 | 894 | 652 | 616 | 577 | 702 | 475 | 461 | 542 | 490 | 535 |
| 2014 | 878 | 979 | 971 | 688 | 450 | 480 | 535 | 516 | 655 | 493 | 613 | 627 |
| 2015 | 977 | 826 | 796 | 669 | 580 | 578 | 452 | 496 | 479 | 748 | 684 | 841 |
| 2016 | 718 | 979 | 1,149 | 692 | 680 | 624 | 936 | 847 | 682 | 690 | 970 | 795 |
| 2017 | 1,041 | 1,093 | 1,108 | 676 | 670 | 511 | 532 | 561 | 777 | 625 | 653 | 699 |
| 2018 | 1,216 | 1,232 | 1,100 | 621 | 644 | 655 | 598 | 619 | 543 | 641 | 771 | 584 |
| 2019 | 913 | 881 | 1,041 | 510 | 494 | 548 | 493 | 446 | 726 | 564 | 793 | 802 |
| 2020 | 848 | 1,086 | 1,083 | 1,306 | 1,069 | 1,173 | 1,043 | 698 | 662 | 815 | 830 | 897 |
| 2021 | 1,088 | 940 | 884 | 482 | 615 | 591 | 607 | 644 | 716 | 726 | 775 | 744 |
| 2022 | 1,126 | 1,266 | 826 | 528 | 580 | 637 | 570 | 552 | 853 | 878 | 801 | 719 |
| 2023 | 947 | 999 | 873 | 602 | 513 | 689 | 607 | 452 | 831 | 727 | 669 | 894 |
| 2024 | 1,047 | |||||||||||
| - = No Data Reported; -- = Not Applicable; NA = Not Available; W = Withheld to avoid disclosure of individual company data. |
| Release Date: 3/29/2024 |
| Next Release Date: 4/30/2024 |