|
Download Data (XLS File) |
|
||||||||
|
||||||||
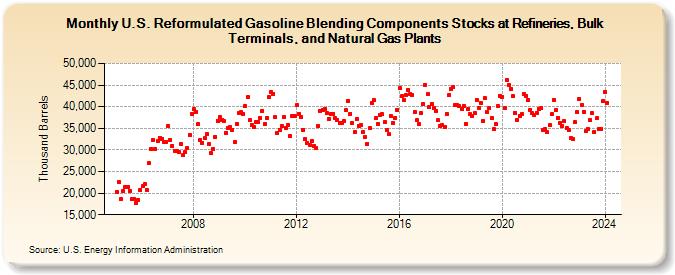
| U.S. Reformulated Gasoline Blending Components Stocks at Refineries, Bulk Terminals, and Natural Gas Plants (Thousand Barrels) | ||||||||
| Year | Jan | Feb | Mar | Apr | May | Jun | Jul | Aug | Sep | Oct | Nov | Dec |
|---|---|---|---|---|---|---|---|---|---|---|---|---|
| 2005 | 20,325 | 22,562 | 18,604 | 20,418 | 21,432 | 21,411 | 20,545 | 18,599 | 18,625 | 17,748 | 18,467 | 20,694 |
| 2006 | 21,540 | 21,999 | 20,786 | 26,931 | 30,181 | 32,312 | 30,262 | 32,012 | 32,846 | 32,577 | 31,859 | 31,889 |
| 2007 | 35,483 | 32,391 | 30,962 | 29,766 | 29,841 | 29,425 | 31,452 | 28,721 | 29,470 | 30,405 | 33,528 | 38,364 |
| 2008 | 39,399 | 38,784 | 36,011 | 32,389 | 31,657 | 32,650 | 33,626 | 31,317 | 29,209 | 30,184 | 33,037 | 36,804 |
| 2009 | 37,546 | 37,030 | 36,755 | 33,969 | 35,166 | 35,189 | 34,696 | 31,713 | 36,048 | 38,527 | 38,674 | 38,412 |
| 2010 | 40,127 | 42,178 | 36,876 | 35,802 | 35,236 | 36,383 | 36,464 | 37,392 | 39,097 | 35,954 | 37,370 | 42,134 |
| 2011 | 43,376 | 43,024 | 37,521 | 33,960 | 34,608 | 35,533 | 37,654 | 35,144 | 35,672 | 33,324 | 37,951 | 37,859 |
| 2012 | 40,371 | 38,400 | 37,574 | 34,707 | 32,443 | 31,546 | 31,139 | 32,091 | 30,925 | 30,527 | 35,535 | 39,085 |
| 2013 | 39,341 | 39,492 | 38,463 | 37,120 | 38,357 | 38,421 | 37,278 | 36,874 | 36,296 | 36,198 | 36,742 | 39,144 |
| 2014 | 41,396 | 38,414 | 36,122 | 34,219 | 37,208 | 35,599 | 35,696 | 34,109 | 33,016 | 31,464 | 34,981 | 40,886 |
| 2015 | 41,460 | 37,395 | 36,042 | 38,093 | 38,219 | 36,514 | 34,524 | 33,619 | 37,769 | 36,207 | 37,453 | 39,227 |
| 2016 | 44,219 | 42,402 | 41,492 | 42,653 | 43,871 | 42,930 | 42,701 | 38,715 | 36,830 | 35,977 | 38,426 | 40,608 |
| 2017 | 44,952 | 42,869 | 39,942 | 40,530 | 39,595 | 39,045 | 36,836 | 35,468 | 35,666 | 35,252 | 38,333 | 42,593 |
| 2018 | 44,080 | 44,457 | 40,294 | 40,353 | 40,096 | 39,400 | 40,086 | 36,100 | 39,489 | 38,243 | 37,841 | 38,519 |
| 2019 | 41,601 | 39,655 | 40,947 | 36,758 | 41,949 | 38,736 | 39,681 | 37,412 | 34,799 | 35,919 | 40,079 | 42,544 |
| 2020 | 42,278 | 39,753 | 46,272 | 44,977 | 44,156 | 42,466 | 38,588 | 37,033 | 37,793 | 38,218 | 42,919 | 42,555 |
| 2021 | 41,499 | 39,343 | 38,514 | 38,074 | 38,624 | 39,464 | 39,614 | 34,566 | 34,859 | 34,052 | 35,648 | 38,193 |
| 2022 | 41,638 | 39,124 | 37,446 | 36,202 | 35,519 | 36,627 | 35,102 | 34,528 | 32,689 | 32,511 | 36,380 | 38,656 |
| 2023 | 41,884 | 40,495 | 38,831 | 34,344 | 34,882 | 36,915 | 38,434 | 34,161 | 37,344 | 34,874 | 34,886 | 41,239 |
| 2024 | 43,403 | |||||||||||
| - = No Data Reported; -- = Not Applicable; NA = Not Available; W = Withheld to avoid disclosure of individual company data. |
| Release Date: 3/29/2024 |
| Next Release Date: 4/30/2024 |