|
Download Data (XLS File) |
|
||||||||
|
||||||||
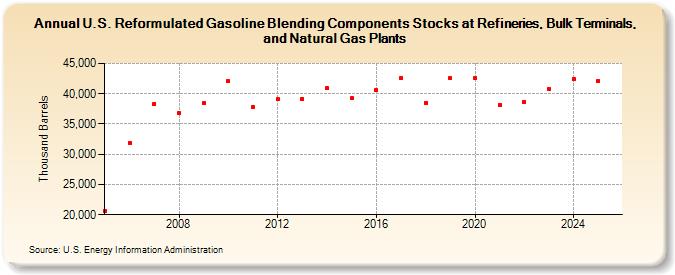
| U.S. Reformulated Gasoline Blending Components Stocks at Refineries, Bulk Terminals, and Natural Gas Plants (Thousand Barrels) | ||||||||
| Decade | Year-0 | Year-1 | Year-2 | Year-3 | Year-4 | Year-5 | Year-6 | Year-7 | Year-8 | Year-9 |
|---|---|---|---|---|---|---|---|---|---|---|
| 2000's | 20,694 | 31,889 | 38,364 | 36,804 | 38,412 | |||||
| 2010's | 42,134 | 37,859 | 39,085 | 39,144 | 40,886 | 39,227 | 40,608 | 42,593 | 38,519 | 42,544 |
| 2020's | 42,555 | 38,193 | 38,656 | 41,239 |
| - = No Data Reported; -- = Not Applicable; NA = Not Available; W = Withheld to avoid disclosure of individual company data. |
| Release Date: 4/30/2024 |
| Next Release Date: 8/30/2024 |