|
Download Data (XLS File) |
|
||||||||
|
||||||||
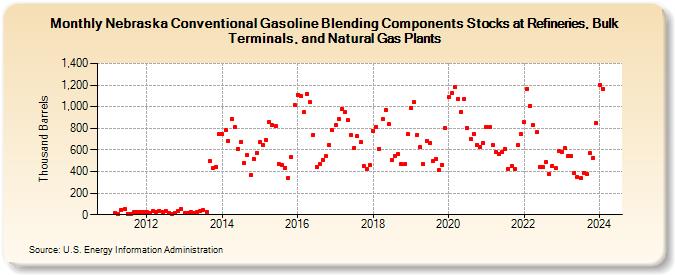
| Nebraska Conventional Gasoline Blending Components Stocks at Refineries, Bulk Terminals, and Natural Gas Plants (Thousand Barrels) | ||||||||
| Year | Jan | Feb | Mar | Apr | May | Jun | Jul | Aug | Sep | Oct | Nov | Dec |
|---|---|---|---|---|---|---|---|---|---|---|---|---|
| 2011 | 19 | 11 | 47 | 49 | 9 | 9 | 21 | 21 | 28 | 28 | ||
| 2012 | 27 | 13 | 31 | 24 | 37 | 28 | 33 | 20 | 9 | 19 | 33 | 51 |
| 2013 | 18 | 14 | 28 | 16 | 22 | 35 | 40 | 27 | 494 | 430 | 446 | 744 |
| 2014 | 744 | 784 | 687 | 888 | 808 | 609 | 677 | 481 | 553 | 369 | 518 | 575 |
| 2015 | 671 | 649 | 692 | 857 | 830 | 817 | 471 | 462 | 436 | 342 | 533 | 1,016 |
| 2016 | 1,111 | 1,098 | 949 | 1,122 | 1,040 | 741 | 442 | 466 | 511 | 539 | 647 | 780 |
| 2017 | 829 | 889 | 980 | 947 | 876 | 734 | 617 | 725 | 670 | 453 | 423 | 460 |
| 2018 | 771 | 811 | 612 | 888 | 969 | 836 | 508 | 543 | 564 | 467 | 465 | 744 |
| 2019 | 991 | 1,043 | 742 | 626 | 468 | 684 | 667 | 499 | 517 | 414 | 463 | 805 |
| 2020 | 1,087 | 1,124 | 1,184 | 1,073 | 954 | 1,071 | 801 | 701 | 751 | 647 | 627 | 665 |
| 2021 | 816 | 811 | 646 | 579 | 563 | 581 | 608 | 427 | 452 | 420 | 643 | 745 |
| 2022 | 857 | 1,167 | 1,010 | 828 | 762 | 441 | 438 | 486 | 380 | 455 | 429 | 592 |
| 2023 | 577 | 618 | 541 | 541 | 390 | 348 | 337 | 387 | 373 | 570 | 523 | 848 |
| 2024 | 1,204 | |||||||||||
| - = No Data Reported; -- = Not Applicable; NA = Not Available; W = Withheld to avoid disclosure of individual company data. |
| Release Date: 3/29/2024 |
| Next Release Date: 4/30/2024 |