|
Download Data (XLS File) |
|
||||||||
|
||||||||
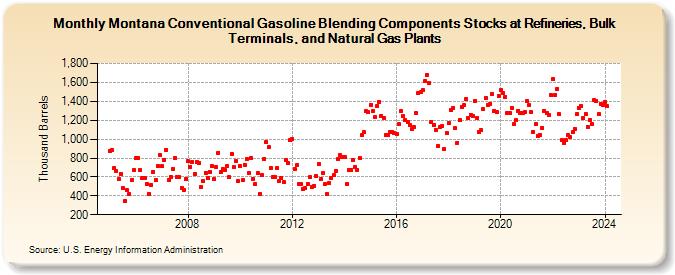
| Montana Conventional Gasoline Blending Components Stocks at Refineries, Bulk Terminals, and Natural Gas Plants (Thousand Barrels) | ||||||||
| Year | Jan | Feb | Mar | Apr | May | Jun | Jul | Aug | Sep | Oct | Nov | Dec |
|---|---|---|---|---|---|---|---|---|---|---|---|---|
| 2005 | 875 | 884 | 693 | 658 | 575 | 632 | 484 | 343 | 457 | 417 | 564 | 671 |
| 2006 | 804 | 799 | 668 | 587 | 585 | 527 | 422 | 515 | 652 | 565 | 713 | 831 |
| 2007 | 712 | 782 | 889 | 568 | 604 | 686 | 802 | 603 | 599 | 484 | 466 | 580 |
| 2008 | 763 | 709 | 760 | 633 | 758 | 748 | 493 | 554 | 646 | 588 | 655 | 714 |
| 2009 | 578 | 706 | 858 | 652 | 686 | 668 | 711 | 596 | 846 | 701 | 766 | 555 |
| 2010 | 714 | 568 | 730 | 790 | 637 | 795 | 583 | 527 | 639 | 422 | 616 | 788 |
| 2011 | 971 | 916 | 698 | 603 | 603 | 689 | 561 | 592 | 544 | 776 | 742 | 987 |
| 2012 | 1,003 | 683 | 721 | 526 | 521 | 474 | 479 | 530 | 595 | 498 | 507 | 609 |
| 2013 | 732 | 575 | 638 | 520 | 420 | 532 | 591 | 619 | 662 | 785 | 829 | 814 |
| 2014 | 807 | 523 | 671 | 676 | 774 | 705 | 678 | 799 | 1,043 | 1,072 | 1,292 | 1,282 |
| 2015 | 1,365 | 1,294 | 1,233 | 1,350 | 1,396 | 1,247 | 1,225 | 1,044 | 1,045 | 1,077 | 1,076 | 1,063 |
| 2016 | 1,057 | 1,155 | 1,292 | 1,248 | 1,199 | 1,185 | 1,153 | 1,105 | 1,123 | 1,275 | 1,483 | 1,495 |
| 2017 | 1,516 | 1,614 | 1,679 | 1,596 | 1,184 | 1,144 | 1,100 | 931 | 1,130 | 1,142 | 895 | 1,062 |
| 2018 | 1,168 | 1,305 | 1,333 | 1,113 | 960 | 1,201 | 1,341 | 1,358 | 1,429 | 1,219 | 1,259 | 1,246 |
| 2019 | 1,404 | 1,223 | 1,077 | 1,093 | 1,314 | 1,439 | 1,365 | 1,374 | 1,480 | 1,302 | 1,284 | 1,452 |
| 2020 | 1,520 | 1,488 | 1,449 | 1,281 | 1,271 | 1,334 | 1,157 | 1,197 | 1,301 | 1,280 | 1,275 | 1,282 |
| 2021 | 1,402 | 1,360 | 1,285 | 1,077 | 1,156 | 1,032 | 1,046 | 1,122 | 1,302 | 1,276 | 1,254 | 1,471 |
| 2022 | 1,636 | 1,465 | 1,532 | 1,262 | 990 | 958 | 988 | 1,039 | 1,017 | 1,072 | 1,111 | 1,262 |
| 2023 | 1,331 | 1,346 | 1,223 | 1,267 | 1,131 | 1,206 | 1,161 | 1,409 | 1,398 | 1,261 | 1,369 | 1,358 |
| 2024 | 1,395 | |||||||||||
| - = No Data Reported; -- = Not Applicable; NA = Not Available; W = Withheld to avoid disclosure of individual company data. |
| Release Date: 3/29/2024 |
| Next Release Date: 4/30/2024 |