|
Download Data (XLS File) |
|
||||||||
|
||||||||
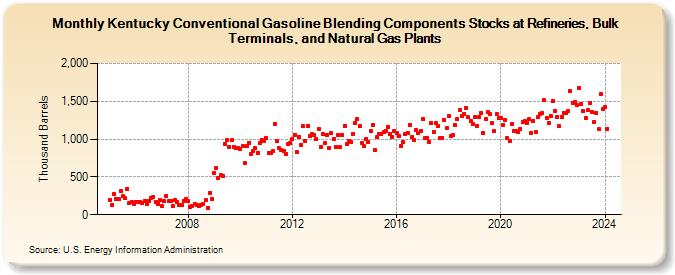
| Kentucky Conventional Gasoline Blending Components Stocks at Refineries, Bulk Terminals, and Natural Gas Plants (Thousand Barrels) | ||||||||
| Year | Jan | Feb | Mar | Apr | May | Jun | Jul | Aug | Sep | Oct | Nov | Dec |
|---|---|---|---|---|---|---|---|---|---|---|---|---|
| 2005 | 199 | 131 | 274 | 202 | 208 | 317 | 244 | 215 | 345 | 155 | 164 | 144 |
| 2006 | 164 | 164 | 172 | 159 | 186 | 144 | 186 | 221 | 238 | 168 | 139 | 191 |
| 2007 | 117 | 181 | 252 | 177 | 181 | 120 | 190 | 162 | 129 | 130 | 187 | 203 |
| 2008 | 183 | 108 | 121 | 144 | 123 | 117 | 132 | 146 | 190 | 94 | 291 | 212 |
| 2009 | 552 | 621 | 490 | 524 | 512 | 937 | 991 | 902 | 982 | 898 | 888 | 885 |
| 2010 | 865 | 906 | 681 | 908 | 955 | 806 | 848 | 876 | 821 | 951 | 988 | 976 |
| 2011 | 1,016 | 822 | 821 | 836 | 1,200 | 971 | 877 | 860 | 846 | 807 | 935 | 945 |
| 2012 | 1,005 | 1,057 | 827 | 1,034 | 928 | 1,167 | 978 | 1,171 | 1,035 | 1,062 | 1,058 | 1,004 |
| 2013 | 1,133 | 900 | 1,074 | 947 | 1,048 | 884 | 1,075 | 1,006 | 902 | 1,050 | 900 | 1,057 |
| 2014 | 1,175 | 939 | 974 | 957 | 1,069 | 1,218 | 1,261 | 1,168 | 947 | 904 | 995 | 961 |
| 2015 | 1,113 | 1,192 | 855 | 1,024 | 1,070 | 1,066 | 1,097 | 1,107 | 1,163 | 1,067 | 1,030 | 1,110 |
| 2016 | 1,076 | 1,038 | 914 | 957 | 1,065 | 1,079 | 1,185 | 1,033 | 982 | 1,122 | 1,084 | 1,106 |
| 2017 | 1,264 | 1,013 | 1,008 | 960 | 1,212 | 1,100 | 1,215 | 1,170 | 1,009 | 1,015 | 1,254 | 1,150 |
| 2018 | 1,307 | 1,035 | 1,056 | 1,180 | 1,263 | 1,382 | 1,310 | 1,336 | 1,412 | 1,286 | 1,241 | 1,195 |
| 2019 | 1,286 | 1,179 | 1,296 | 1,343 | 1,085 | 1,263 | 1,361 | 1,328 | 1,207 | 1,101 | 1,327 | 1,278 |
| 2020 | 1,282 | 1,193 | 1,258 | 1,010 | 973 | 1,204 | 1,113 | 1,105 | 1,094 | 1,139 | 1,229 | 1,236 |
| 2021 | 1,213 | 1,262 | 1,082 | 1,240 | 1,095 | 1,287 | 1,331 | 1,342 | 1,516 | 1,280 | 1,219 | 1,306 |
| 2022 | 1,502 | 1,365 | 1,292 | 1,169 | 1,297 | 1,347 | 1,341 | 1,365 | 1,639 | 1,482 | 1,484 | 1,446 |
| 2023 | 1,672 | 1,468 | 1,370 | 1,276 | 1,379 | 1,476 | 1,352 | 1,229 | 1,349 | 1,127 | 1,592 | 1,398 |
| 2024 | 1,430 | |||||||||||
| - = No Data Reported; -- = Not Applicable; NA = Not Available; W = Withheld to avoid disclosure of individual company data. |
| Release Date: 3/29/2024 |
| Next Release Date: 4/30/2024 |