|
Download Data (XLS File) |
|
||||||||
|
||||||||
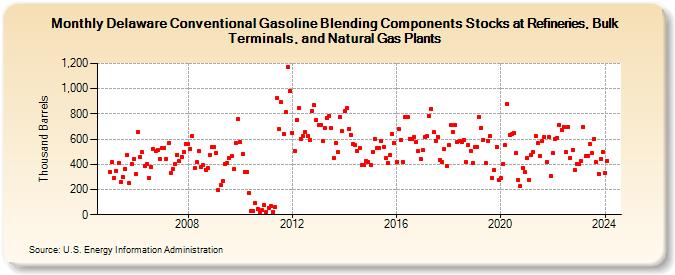
| Delaware Conventional Gasoline Blending Components Stocks at Refineries, Bulk Terminals, and Natural Gas Plants (Thousand Barrels) | ||||||||
| Year | Jan | Feb | Mar | Apr | May | Jun | Jul | Aug | Sep | Oct | Nov | Dec |
|---|---|---|---|---|---|---|---|---|---|---|---|---|
| 2005 | 342 | 418 | 292 | 349 | 409 | 260 | 300 | 363 | 471 | 250 | 405 | 445 |
| 2006 | 323 | 660 | 459 | 494 | 383 | 399 | 293 | 379 | 518 | 507 | 511 | 446 |
| 2007 | 531 | 531 | 443 | 568 | 331 | 360 | 400 | 477 | 423 | 459 | 495 | 560 |
| 2008 | 558 | 522 | 622 | 370 | 416 | 504 | 375 | 392 | 356 | 368 | 477 | 534 |
| 2009 | 534 | 491 | 200 | 238 | 264 | 404 | 414 | 452 | 465 | 360 | 568 | 757 |
| 2010 | 576 | 485 | 338 | 337 | 172 | 31 | 32 | 90 | 48 | 24 | 35 | 75 |
| 2011 | 24 | 56 | 69 | 23 | 58 | 925 | 677 | 891 | 640 | 812 | 1,169 | 983 |
| 2012 | 652 | 506 | 754 | 846 | 600 | 622 | 656 | 623 | 596 | 821 | 867 | 755 |
| 2013 | 715 | 715 | 582 | 686 | 770 | 785 | 687 | 453 | 571 | 498 | 772 | 664 |
| 2014 | 820 | 843 | 684 | 635 | 563 | 550 | 503 | 530 | 391 | 391 | 427 | 420 |
| 2015 | 397 | 500 | 603 | 527 | 526 | 583 | 541 | 449 | 412 | 474 | 641 | 572 |
| 2016 | 418 | 682 | 594 | 417 | 773 | 777 | 603 | 603 | 617 | 574 | 503 | 441 |
| 2017 | 512 | 617 | 622 | 782 | 839 | 655 | 587 | 620 | 435 | 417 | 522 | 386 |
| 2018 | 552 | 711 | 656 | 710 | 578 | 582 | 574 | 592 | 419 | 553 | 508 | 413 |
| 2019 | 537 | 539 | 776 | 692 | 596 | 407 | 583 | 624 | 290 | 356 | 539 | 277 |
| 2020 | 288 | 403 | 550 | 877 | 632 | 638 | 651 | 490 | 275 | 227 | 367 | 339 |
| 2021 | 449 | 277 | 474 | 501 | 625 | 567 | 469 | 586 | 615 | 422 | 619 | 309 |
| 2022 | 489 | 602 | 611 | 711 | 676 | 698 | 496 | 698 | 451 | 516 | 353 | 404 |
| 2023 | 399 | 424 | 696 | 463 | 468 | 559 | 486 | 600 | 415 | 326 | 445 | 500 |
| 2024 | 332 | |||||||||||
| - = No Data Reported; -- = Not Applicable; NA = Not Available; W = Withheld to avoid disclosure of individual company data. |
| Release Date: 3/29/2024 |
| Next Release Date: 4/30/2024 |