|
Download Data (XLS File) |
|
||||||||
|
||||||||
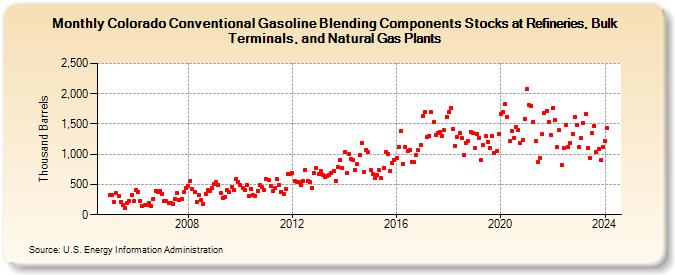
| Colorado Conventional Gasoline Blending Components Stocks at Refineries, Bulk Terminals, and Natural Gas Plants (Thousand Barrels) | ||||||||
| Year | Jan | Feb | Mar | Apr | May | Jun | Jul | Aug | Sep | Oct | Nov | Dec |
|---|---|---|---|---|---|---|---|---|---|---|---|---|
| 2005 | 320 | 332 | 217 | 355 | 312 | 216 | 153 | 114 | 188 | 224 | 323 | 229 |
| 2006 | 416 | 379 | 234 | 143 | 154 | 168 | 191 | 137 | 266 | 400 | 380 | 391 |
| 2007 | 350 | 219 | 224 | 200 | 186 | 176 | 265 | 356 | 243 | 267 | 369 | 442 |
| 2008 | 478 | 561 | 420 | 369 | 218 | 324 | 236 | 173 | 349 | 402 | 399 | 434 |
| 2009 | 516 | 543 | 493 | 363 | 279 | 300 | 403 | 383 | 452 | 414 | 589 | 543 |
| 2010 | 496 | 448 | 403 | 498 | 315 | 431 | 324 | 312 | 397 | 491 | 454 | 410 |
| 2011 | 594 | 571 | 471 | 384 | 447 | 585 | 496 | 381 | 339 | 426 | 665 | 676 |
| 2012 | 688 | 552 | 545 | 541 | 484 | 558 | 745 | 556 | 534 | 443 | 684 | 772 |
| 2013 | 676 | 727 | 663 | 618 | 639 | 657 | 682 | 730 | 552 | 786 | 901 | 770 |
| 2014 | 1,034 | 686 | 999 | 925 | 905 | 739 | 836 | 988 | 1,190 | 712 | 1,074 | 1,031 |
| 2015 | 736 | 674 | 602 | 661 | 733 | 599 | 779 | 1,039 | 1,008 | 727 | 857 | 899 |
| 2016 | 931 | 1,121 | 1,381 | 836 | 1,127 | 1,057 | 1,077 | 877 | 864 | 980 | 1,065 | 1,146 |
| 2017 | 1,632 | 1,693 | 1,281 | 1,309 | 1,695 | 1,526 | 1,317 | 1,359 | 1,374 | 1,298 | 1,393 | 1,623 |
| 2018 | 1,690 | 1,761 | 1,421 | 1,142 | 1,277 | 1,349 | 1,274 | 989 | 1,188 | 1,223 | 1,369 | 1,349 |
| 2019 | 1,097 | 1,335 | 1,272 | 897 | 1,152 | 1,293 | 1,208 | 1,104 | 1,293 | 1,024 | 1,048 | 1,342 |
| 2020 | 1,661 | 1,698 | 1,828 | 1,617 | 1,211 | 1,386 | 1,271 | 1,455 | 1,403 | 1,178 | 1,230 | 1,588 |
| 2021 | 2,074 | 1,808 | 1,803 | 1,540 | 1,213 | 867 | 936 | 1,330 | 1,683 | 1,722 | 1,534 | 1,314 |
| 2022 | 1,768 | 1,569 | 1,120 | 1,393 | 814 | 1,101 | 1,482 | 1,119 | 1,188 | 1,332 | 1,610 | 1,486 |
| 2023 | 1,112 | 1,263 | 1,524 | 1,662 | 1,110 | 945 | 1,354 | 1,465 | 1,034 | 1,085 | 900 | 1,113 |
| 2024 | 1,211 | |||||||||||
| - = No Data Reported; -- = Not Applicable; NA = Not Available; W = Withheld to avoid disclosure of individual company data. |
| Release Date: 3/29/2024 |
| Next Release Date: 4/30/2024 |