|
Download Data (XLS File) |
|
||||||||
|
||||||||
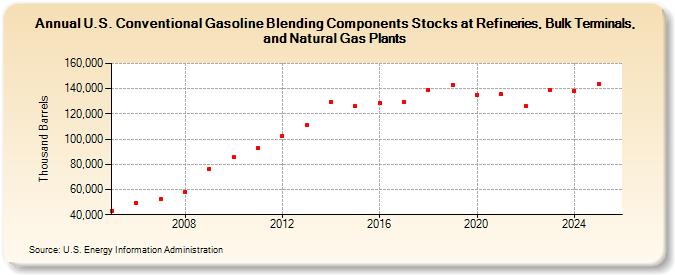
| U.S. Conventional Gasoline Blending Components Stocks at Refineries, Bulk Terminals, and Natural Gas Plants (Thousand Barrels) | ||||||||
| Decade | Year-0 | Year-1 | Year-2 | Year-3 | Year-4 | Year-5 | Year-6 | Year-7 | Year-8 | Year-9 |
|---|---|---|---|---|---|---|---|---|---|---|
| 2000's | 43,133 | 49,225 | 52,343 | 58,114 | 76,583 | |||||
| 2010's | 85,439 | 92,743 | 102,543 | 110,800 | 129,556 | 125,896 | 128,887 | 129,539 | 139,251 | 143,294 |
| 2020's | 135,296 | 135,531 | 126,305 | 139,320 |
| - = No Data Reported; -- = Not Applicable; NA = Not Available; W = Withheld to avoid disclosure of individual company data. |
| Release Date: 3/29/2024 |
| Next Release Date: 8/30/2024 |