|
Download Data (XLS File) |
|
||||||||
|
||||||||
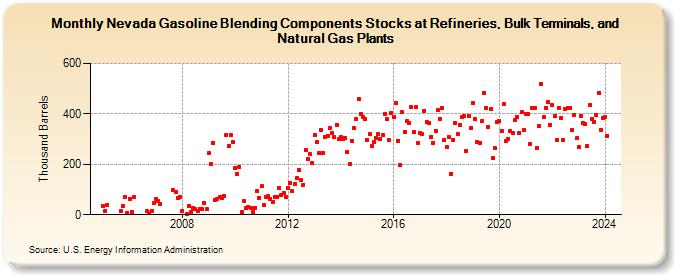
| Nevada Gasoline Blending Components Stocks at Refineries, Bulk Terminals, and Natural Gas Plants (Thousand Barrels) | ||||||||
| Year | Jan | Feb | Mar | Apr | May | Jun | Jul | Aug | Sep | Oct | Nov | Dec |
|---|---|---|---|---|---|---|---|---|---|---|---|---|
| 2005 | 35 | 16 | 40 | 16 | 36 | 71 | 8 | |||||
| 2006 | 63 | 11 | 72 | 13 | 5 | 14 | 47 | |||||
| 2007 | 63 | 55 | 42 | 97 | 92 | 65 | 69 | |||||
| 2008 | 16 | 4 | 36 | 12 | 25 | 22 | 13 | 21 | 22 | 47 | 21 | |
| 2009 | 243 | 202 | 286 | 58 | 63 | 71 | 67 | 75 | 318 | 273 | 317 | 288 |
| 2010 | 184 | 162 | 190 | 10 | 53 | 25 | 32 | 27 | 12 | 28 | 95 | 67 |
| 2011 | 112 | 37 | 70 | 73 | 61 | 51 | 72 | 69 | 107 | 77 | 87 | 71 |
| 2012 | 106 | 126 | 93 | 121 | 145 | 178 | 136 | 119 | 258 | 220 | 239 | 205 |
| 2013 | 318 | 287 | 244 | 337 | 244 | 307 | 312 | 344 | 323 | 310 | 355 | 302 |
| 2014 | 308 | 300 | 305 | 249 | 203 | 292 | 343 | 380 | 461 | 401 | 388 | 380 |
| 2015 | 296 | 320 | 271 | 289 | 306 | 320 | 300 | 318 | 401 | 378 | 295 | 404 |
| 2016 | 386 | 443 | 294 | 197 | 406 | 330 | 371 | 363 | 429 | 329 | 426 | 283 |
| 2017 | 323 | 320 | 413 | 369 | 363 | 310 | 286 | 334 | 414 | 381 | 423 | 298 |
| 2018 | 267 | 307 | 163 | 298 | 363 | 319 | 355 | 386 | 392 | 253 | 392 | 345 |
| 2019 | 445 | 378 | 290 | 283 | 370 | 484 | 422 | 349 | 419 | 224 | 264 | 369 |
| 2020 | 370 | 333 | 440 | 292 | 300 | 331 | 324 | 374 | 389 | 326 | 406 | 337 |
| 2021 | 400 | 400 | 281 | 424 | 422 | 266 | 352 | 518 | 386 | 425 | 446 | 355 |
| 2022 | 434 | 392 | 296 | 424 | 384 | 295 | 419 | 423 | 425 | 338 | 397 | 303 |
| 2023 | 268 | 392 | 364 | 358 | 273 | 435 | 379 | 369 | 397 | 482 | 337 | 385 |
| 2024 | 388 | |||||||||||
| - = No Data Reported; -- = Not Applicable; NA = Not Available; W = Withheld to avoid disclosure of individual company data. |
| Release Date: 3/29/2024 |
| Next Release Date: 4/30/2024 |