|
Download Data (XLS File) |
|
||||||||
|
||||||||
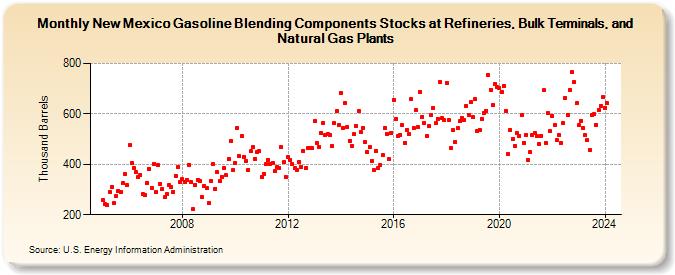
| New Mexico Gasoline Blending Components Stocks at Refineries, Bulk Terminals, and Natural Gas Plants (Thousand Barrels) | ||||||||
| Year | Jan | Feb | Mar | Apr | May | Jun | Jul | Aug | Sep | Oct | Nov | Dec |
|---|---|---|---|---|---|---|---|---|---|---|---|---|
| 2005 | 257 | 242 | 237 | 292 | 310 | 246 | 275 | 295 | 291 | 326 | 360 | 316 |
| 2006 | 476 | 404 | 387 | 368 | 350 | 356 | 282 | 278 | 326 | 381 | 307 | 403 |
| 2007 | 291 | 396 | 323 | 303 | 269 | 281 | 316 | 309 | 290 | 355 | 390 | 328 |
| 2008 | 340 | 331 | 339 | 399 | 330 | 221 | 319 | 339 | 334 | 270 | 314 | 305 |
| 2009 | 245 | 334 | 401 | 304 | 368 | 332 | 351 | 384 | 356 | 422 | 492 | 377 |
| 2010 | 406 | 545 | 431 | 513 | 430 | 414 | 379 | 451 | 467 | 423 | 449 | 451 |
| 2011 | 349 | 363 | 401 | 419 | 403 | 407 | 372 | 389 | 387 | 467 | 408 | 350 |
| 2012 | 429 | 417 | 401 | 385 | 377 | 411 | 391 | 453 | 384 | 464 | 465 | 463 |
| 2013 | 571 | 486 | 470 | 525 | 565 | 518 | 521 | 516 | 472 | 563 | 611 | 556 |
| 2014 | 683 | 545 | 644 | 549 | 494 | 474 | 519 | 553 | 610 | 529 | 546 | 487 |
| 2015 | 447 | 469 | 415 | 377 | 453 | 387 | 398 | 436 | 546 | 522 | 420 | 526 |
| 2016 | 657 | 579 | 513 | 518 | 555 | 486 | 538 | 519 | 659 | 546 | 614 | 547 |
| 2017 | 686 | 589 | 563 | 514 | 553 | 594 | 624 | 562 | 580 | 727 | 582 | 575 |
| 2018 | 724 | 576 | 466 | 535 | 490 | 544 | 570 | 585 | 575 | 631 | 597 | 646 |
| 2019 | 587 | 658 | 534 | 538 | 581 | 605 | 613 | 753 | 696 | 635 | 719 | 705 |
| 2020 | 701 | 687 | 712 | 612 | 440 | 537 | 500 | 473 | 524 | 514 | 596 | 486 |
| 2021 | 518 | 419 | 447 | 515 | 523 | 511 | 480 | 512 | 693 | 485 | 603 | 531 |
| 2022 | 591 | 554 | 495 | 516 | 484 | 563 | 665 | 596 | 696 | 766 | 726 | 642 |
| 2023 | 554 | 572 | 545 | 515 | 495 | 458 | 594 | 598 | 557 | 614 | 633 | 666 |
| 2024 | 624 | |||||||||||
| - = No Data Reported; -- = Not Applicable; NA = Not Available; W = Withheld to avoid disclosure of individual company data. |
| Release Date: 3/29/2024 |
| Next Release Date: 4/30/2024 |