|
Download Data (XLS File) |
|
||||||||
|
||||||||
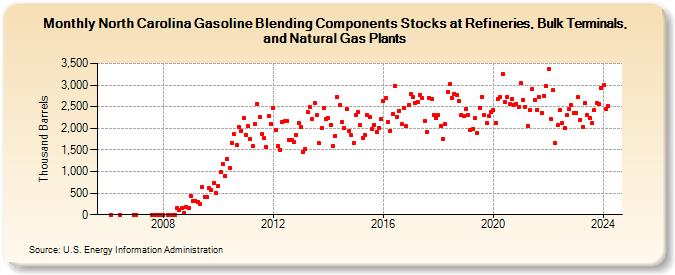
| North Carolina Gasoline Blending Components Stocks at Refineries, Bulk Terminals, and Natural Gas Plants (Thousand Barrels) | ||||||||
| Year | Jan | Feb | Mar | Apr | May | Jun | Jul | Aug | Sep | Oct | Nov | Dec |
|---|---|---|---|---|---|---|---|---|---|---|---|---|
| 2006 | 1 | 1 | 1 | |||||||||
| 2007 | 1 | 1 | 1 | 1 | 1 | |||||||
| 2008 | 1 | 1 | 1 | 1 | 161 | 110 | 148 | 39 | 182 | 145 | ||
| 2009 | 444 | 324 | 324 | 302 | 240 | 641 | 416 | 420 | 614 | 577 | 730 | 509 |
| 2010 | 665 | 986 | 1,173 | 892 | 1,293 | 1,083 | 1,659 | 1,861 | 1,608 | 2,022 | 1,932 | 2,230 |
| 2011 | 1,851 | 2,046 | 1,744 | 1,581 | 2,094 | 2,572 | 2,268 | 1,863 | 1,767 | 1,568 | 2,279 | 2,103 |
| 2012 | 2,476 | 1,950 | 1,600 | 1,506 | 2,138 | 2,167 | 2,164 | 1,739 | 1,726 | 1,679 | 1,841 | 2,118 |
| 2013 | 2,036 | 1,460 | 1,510 | 2,379 | 2,493 | 2,214 | 2,580 | 2,310 | 1,651 | 2,004 | 2,478 | 2,224 |
| 2014 | 2,235 | 2,085 | 1,596 | 1,824 | 2,724 | 2,542 | 2,136 | 2,008 | 2,451 | 1,945 | 1,835 | 1,665 |
| 2015 | 2,305 | 2,382 | 2,068 | 1,783 | 1,849 | 2,298 | 2,253 | 1,991 | 2,082 | 1,916 | 2,012 | 2,226 |
| 2016 | 2,643 | 2,711 | 2,153 | 1,947 | 2,335 | 2,987 | 2,265 | 2,407 | 2,091 | 2,478 | 2,045 | 2,528 |
| 2017 | 2,799 | 2,721 | 2,575 | 2,609 | 2,780 | 2,704 | 2,174 | 1,911 | 2,705 | 2,688 | 2,316 | 2,232 |
| 2018 | 2,314 | 2,051 | 1,762 | 2,096 | 2,839 | 3,021 | 2,691 | 2,800 | 2,774 | 2,634 | 2,312 | 2,274 |
| 2019 | 2,435 | 2,298 | 1,968 | 1,985 | 2,244 | 1,897 | 2,480 | 2,727 | 2,306 | 2,123 | 2,283 | 2,376 |
| 2020 | 2,420 | 2,134 | 2,678 | 2,716 | 3,251 | 2,620 | 2,727 | 2,567 | 2,676 | 2,545 | 2,567 | 2,493 |
| 2021 | 3,037 | 2,647 | 2,502 | 2,060 | 2,422 | 2,909 | 2,663 | 2,427 | 2,714 | 2,356 | 2,758 | 2,983 |
| 2022 | 3,366 | 2,224 | 2,878 | 1,649 | 2,065 | 2,420 | 2,118 | 2,001 | 2,298 | 2,435 | 2,537 | 2,365 |
| 2023 | 2,370 | 2,713 | 2,196 | 2,017 | 2,596 | 2,297 | 2,238 | 2,119 | 2,420 | 2,579 | 2,561 | 2,937 |
| 2024 | 2,991 | 2,458 | 2,511 | 1,620 | 2,374 | 2,152 | ||||||
| - = No Data Reported; -- = Not Applicable; NA = Not Available; W = Withheld to avoid disclosure of individual company data. |
| Release Date: 8/30/2024 |
| Next Release Date: 9/30/2024 |