|
Download Data (XLS File) |
|
||||||||
|
||||||||
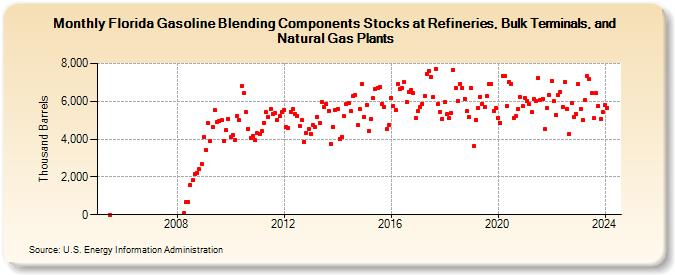
| Florida Gasoline Blending Components Stocks at Refineries, Bulk Terminals, and Natural Gas Plants (Thousand Barrels) | ||||||||
| Year | Jan | Feb | Mar | Apr | May | Jun | Jul | Aug | Sep | Oct | Nov | Dec |
|---|---|---|---|---|---|---|---|---|---|---|---|---|
| 2005 | 1 | |||||||||||
| 2008 | 72 | 659 | 690 | 1,581 | 1,810 | 2,157 | 2,211 | 2,402 | 2,701 | |||
| 2009 | 4,103 | 3,426 | 4,856 | 3,879 | 4,646 | 5,530 | 4,921 | 4,942 | 4,986 | 3,917 | 4,457 | 5,046 |
| 2010 | 4,095 | 4,205 | 3,953 | 5,236 | 4,996 | 6,833 | 6,433 | 5,419 | 4,548 | 4,034 | 4,186 | 3,937 |
| 2011 | 4,299 | 4,267 | 4,437 | 4,868 | 5,410 | 5,188 | 5,592 | 5,320 | 5,375 | 5,016 | 5,198 | 5,420 |
| 2012 | 5,532 | 4,633 | 4,580 | 5,456 | 5,584 | 5,314 | 5,225 | 4,709 | 5,004 | 3,861 | 4,310 | 4,523 |
| 2013 | 4,255 | 4,734 | 4,630 | 5,195 | 4,862 | 5,977 | 5,718 | 5,838 | 5,481 | 3,732 | 4,646 | 5,555 |
| 2014 | 5,603 | 4,012 | 4,125 | 5,215 | 5,873 | 5,892 | 5,482 | 6,276 | 6,341 | 4,725 | 5,588 | 6,916 |
| 2015 | 5,189 | 5,797 | 4,411 | 5,086 | 6,148 | 6,644 | 6,724 | 6,773 | 5,878 | 5,714 | 4,510 | 4,735 |
| 2016 | 6,175 | 5,746 | 5,520 | 6,917 | 6,667 | 6,703 | 6,994 | 5,955 | 6,486 | 6,601 | 6,428 | 5,099 |
| 2017 | 5,478 | 5,716 | 5,876 | 6,277 | 7,446 | 7,602 | 7,269 | 6,227 | 7,734 | 5,865 | 5,459 | 5,088 |
| 2018 | 5,951 | 5,303 | 5,106 | 5,386 | 7,644 | 6,706 | 6,033 | 6,935 | 6,714 | 6,138 | 5,471 | 5,178 |
| 2019 | 6,713 | 3,633 | 5,022 | 5,652 | 6,246 | 5,874 | 5,676 | 6,264 | 6,919 | 6,910 | 5,492 | 5,649 |
| 2020 | 5,118 | 4,849 | 7,352 | 7,316 | 5,749 | 7,026 | 6,927 | 5,129 | 5,201 | 5,587 | 6,226 | 5,725 |
| 2021 | 6,188 | 6,011 | 5,839 | 5,430 | 6,120 | 6,024 | 7,245 | 6,090 | 6,147 | 4,527 | 5,637 | 6,335 |
| 2022 | 7,089 | 5,992 | 5,278 | 6,313 | 6,485 | 5,704 | 7,011 | 5,577 | 4,278 | 5,885 | 5,175 | 5,338 |
| 2023 | 6,899 | 5,593 | 5,010 | 6,067 | 7,343 | 7,163 | 6,434 | 5,112 | 6,416 | 5,765 | 5,063 | 5,415 |
| 2024 | 5,803 | |||||||||||
| - = No Data Reported; -- = Not Applicable; NA = Not Available; W = Withheld to avoid disclosure of individual company data. |
| Release Date: 3/29/2024 |
| Next Release Date: 4/30/2024 |