|
Download Data (XLS File) |
|
||||||||
|
||||||||
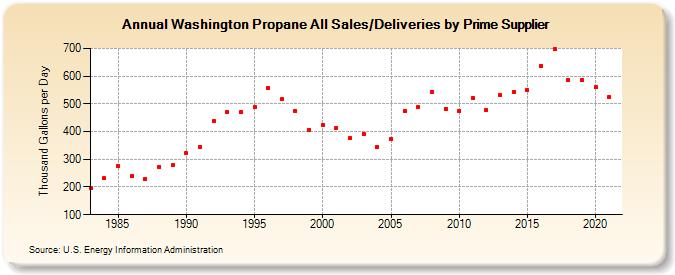
| Washington Propane All Sales/Deliveries by Prime Supplier (Thousand Gallons per Day) | ||||||||
| Decade | Year-0 | Year-1 | Year-2 | Year-3 | Year-4 | Year-5 | Year-6 | Year-7 | Year-8 | Year-9 |
|---|---|---|---|---|---|---|---|---|---|---|
| 1980's | 196.9 | 231.7 | 276.8 | 239.4 | 229.7 | 273.3 | 278.3 | |||
| 1990's | 321.1 | 344.7 | 436.5 | 470.9 | 469.3 | 487.3 | 558.4 | 516.5 | 475.4 | 407.3 |
| 2000's | 423.2 | 414.5 | 377.5 | 392.5 | 345.7 | 373.0 | 474.6 | 488.6 | 543.5 | 482.7 |
| 2010's | 475.7 | 520.8 | 477.4 | 531.7 | 544.1 | 549.3 | 636.8 | 696.1 | 585.6 | 587.2 |
| 2020's | 559.7 |
| - = No Data Reported; -- = Not Applicable; NA = Not Available; W = Withheld to avoid disclosure of individual company data. |
| Release Date: 6/1/2022 |
| Next Release Date: TBD |