|
Download Data (XLS File) |
|
||||||||
|
||||||||
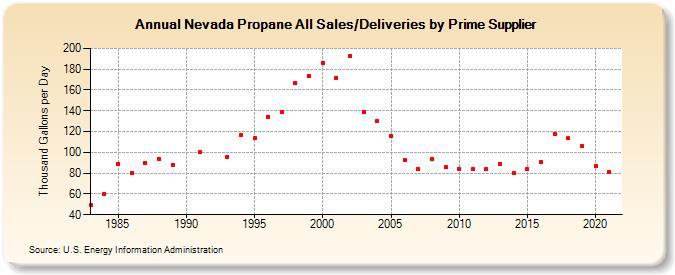
| Nevada Propane All Sales/Deliveries by Prime Supplier (Thousand Gallons per Day) | ||||||||
| Decade | Year-0 | Year-1 | Year-2 | Year-3 | Year-4 | Year-5 | Year-6 | Year-7 | Year-8 | Year-9 |
|---|---|---|---|---|---|---|---|---|---|---|
| 1980's | 49.1 | 59.9 | 89.1 | 79.8 | 89.8 | 93.5 | 88.1 | |||
| 1990's | W | 99.9 | W | 95.6 | 116.6 | 113.5 | 134.3 | 138.7 | 166.9 | 173.4 |
| 2000's | 186.4 | 171.9 | 192.8 | 139.0 | 130.0 | 115.7 | 92.4 | 84.4 | 93.6 | 85.6 |
| 2010's | 83.7 | 84.0 | 84.1 | 88.8 | 80.0 | 84.1 | 90.8 | 118.0 | 113.5 | 106.1 |
| 2020's | 86.9 |
| - = No Data Reported; -- = Not Applicable; NA = Not Available; W = Withheld to avoid disclosure of individual company data. |
| Release Date: 6/1/2022 |
| Next Release Date: TBD |