|
Download Data (XLS File) |
|
||||||||
|
||||||||
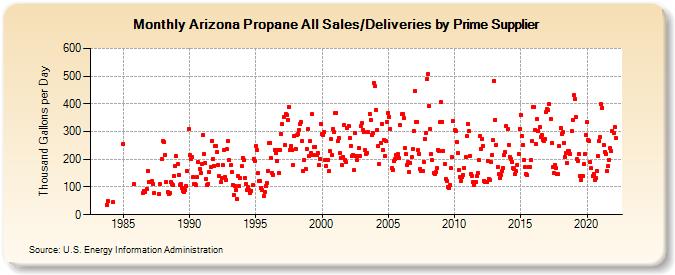
| Arizona Propane All Sales/Deliveries by Prime Supplier (Thousand Gallons per Day) | ||||||||
| Year | Jan | Feb | Mar | Apr | May | Jun | Jul | Aug | Sep | Oct | Nov | Dec |
|---|---|---|---|---|---|---|---|---|---|---|---|---|
| 1983 | W | W | W | W | W | W | W | W | W | 36.5 | 48.8 | W |
| 1984 | W | W | W | 44.9 | W | W | W | W | W | W | W | W |
| 1985 | 255.1 | W | W | W | W | W | W | W | W | W | 110.2 | W |
| 1986 | W | W | W | W | W | W | 78.8 | 86.9 | 80.6 | 92.4 | 159.4 | 118.3 |
| 1987 | W | W | 120.2 | 110.2 | 76.7 | W | W | W | 73.9 | 110.6 | W | 199.8 |
| 1988 | 265.4 | 263.8 | 216.2 | 117.3 | 81.8 | 75.5 | 77.3 | 117.5 | 111.3 | 105.8 | 140.1 | 176.2 |
| 1989 | 210.5 | 182.8 | 144.5 | 107.5 | 112.5 | 96.9 | 86.6 | 82.2 | 89.0 | 103.0 | 156.5 | 309.4 |
| 1990 | 214.4 | 201.7 | 209.4 | 135.0 | 111.1 | 109.7 | 106.3 | 135.1 | 189.0 | 164.4 | 149.2 | 183.4 |
| 1991 | 286.2 | 218.8 | 185.7 | 129.2 | 107.9 | 111.3 | 153.6 | 172.2 | 267.3 | 200.2 | 177.1 | 247.2 |
| 1992 | 248.1 | 227.1 | 180.4 | 139.2 | 117.9 | 130.7 | 177.6 | 233.4 | 136.2 | 126.6 | 235.5 | 266.7 |
| 1993 | 197.3 | 178.1 | 153.2 | 108.3 | 71.7 | 104.8 | 88.0 | 54.9 | 138.4 | 102.7 | 131.3 | 175.3 |
| 1994 | 205.6 | 195.8 | 133.7 | 111.4 | 88.1 | 99.5 | 88.7 | 79.2 | 85.0 | 106.1 | 202.7 | 193.7 |
| 1995 | 247.5 | 233.1 | 148.9 | 120.8 | 121.3 | 98.0 | 88.9 | 67.0 | 81.3 | 102.6 | 116.2 | 158.5 |
| 1996 | 257.8 | 260.3 | 205.0 | 148.7 | 144.8 | 233.8 | 221.5 | 195.4 | 232.8 | 150.3 | 233.0 | 289.7 |
| 1997 | 325.8 | 351.6 | 251.7 | 363.1 | 358.2 | 342.0 | 389.8 | 233.1 | 248.5 | 232.5 | 180.0 | 284.3 |
| 1998 | 237.2 | 286.0 | 290.5 | 306.0 | 327.2 | 334.2 | 264.4 | 156.5 | 197.9 | 165.7 | 238.3 | 307.9 |
| 1999 | 211.5 | 264.3 | 222.5 | 362.6 | 216.1 | 243.5 | 246.0 | 215.5 | 222.7 | 177.9 | 201.8 | 327.9 |
| 2000 | 292.8 | 286.7 | 299.6 | 198.7 | 176.2 | 198.1 | 156.2 | 228.1 | 272.3 | 216.1 | 308.0 | 298.6 |
| 2001 | 365.6 | 367.2 | 265.0 | 278.3 | 221.5 | 205.2 | 180.9 | 208.9 | 323.7 | 198.8 | 188.5 | 314.4 |
| 2002 | 321.3 | 277.7 | 248.7 | 210.5 | 214.9 | 159.8 | 295.3 | 212.9 | 197.6 | 239.9 | 212.7 | 319.4 |
| 2003 | 330.1 | 306.9 | 300.1 | 232.6 | 220.2 | 224.1 | 296.8 | 364.6 | 342.5 | 288.2 | 294.7 | 476.1 |
| 2004 | 462.8 | 379.0 | 307.1 | 246.5 | 184.0 | 259.9 | 328.5 | 232.7 | 268.8 | 210.2 | 264.9 | 335.4 |
| 2005 | 368.0 | 353.9 | 309.6 | 167.7 | 161.2 | 192.8 | 199.3 | 216.0 | 205.4 | 217.4 | 203.4 | 322.8 |
| 2006 | 361.8 | 363.3 | 348.6 | 239.3 | 218.5 | 179.2 | 190.1 | 152.6 | 188.3 | 207.6 | 235.4 | 303.2 |
| 2007 | 445.5 | 334.6 | 335.2 | 232.3 | 220.2 | 165.4 | 156.0 | 157.7 | 191.8 | 273.4 | 294.9 | 487.8 |
| 2008 | 508.5 | 391.9 | 308.0 | 219.4 | 195.6 | 151.8 | 147.0 | 154.4 | 167.6 | 234.6 | 231.2 | 333.6 |
| 2009 | 405.1 | 335.9 | 230.8 | 184.6 | 129.6 | 120.8 | 101.6 | 97.6 | 107.6 | 167.4 | 208.5 | 337.1 |
| 2010 | 305.6 | 300.2 | 261.0 | 223.0 | 162.7 | 135.9 | 121.8 | 135.0 | 144.9 | 168.7 | 208.2 | 283.8 |
| 2011 | 328.4 | 301.6 | 213.4 | 147.5 | 141.0 | 117.8 | 107.3 | 118.4 | 137.9 | 151.5 | 196.3 | 282.4 |
| 2012 | 237.1 | 274.0 | 249.1 | 122.4 | 117.4 | 118.7 | 195.5 | 129.8 | 125.1 | 188.4 | 216.4 | 268.1 |
| 2013 | 484.0 | 342.8 | 252.7 | 173.2 | 145.6 | 132.0 | 142.2 | 156.7 | 168.7 | 214.5 | 225.7 | 318.3 |
| 2014 | 308.0 | 253.2 | 209.4 | 201.4 | 190.3 | 167.7 | 165.3 | 146.9 | 157.6 | 180.6 | 218.7 | 310.2 |
| 2015 | 360.7 | 284.3 | 252.4 | 197.2 | 171.6 | 147.4 | 141.5 | 172.3 | 173.2 | 195.6 | 264.6 | 389.6 |
| 2016 | 388.5 | 306.9 | 256.0 | 346.1 | 302.1 | 316.0 | 280.9 | 287.8 | 268.1 | 267.5 | 272.3 | 369.9 |
| 2017 | 381.6 | 376.2 | 397.7 | 347.0 | 257.6 | 171.3 | 151.5 | 181.1 | 166.8 | 145.1 | 147.0 | 246.3 |
| 2018 | 314.3 | 292.2 | 297.2 | 259.8 | 207.5 | 223.5 | 187.8 | 230.2 | 228.4 | 218.5 | 300.4 | 342.9 |
| 2019 | 430.4 | 417.7 | 353.8 | 200.0 | 194.1 | 220.1 | 140.2 | 126.8 | 140.4 | 181.3 | 219.9 | 288.6 |
| 2020 | 333.3 | 270.9 | 266.9 | 189.7 | 167.5 | 139.6 | 147.7 | 124.2 | 131.7 | 159.1 | 211.2 | 266.2 |
| 2021 | 280.0 | 398.3 | 385.5 | 252.0 | 226.6 | 220.0 | 157.3 | 175.3 | 198.5 | 240.1 | 229.8 | 302.9 |
| 2022 | 296.4 | 317.2 | 277.1 | |||||||||
| - = No Data Reported; -- = Not Applicable; NA = Not Available; W = Withheld to avoid disclosure of individual company data. |
| Release Date: 5/19/2022 |
| Next Release Date: TBD |