|
Download Data (XLS File) |
|
||||||||
|
||||||||
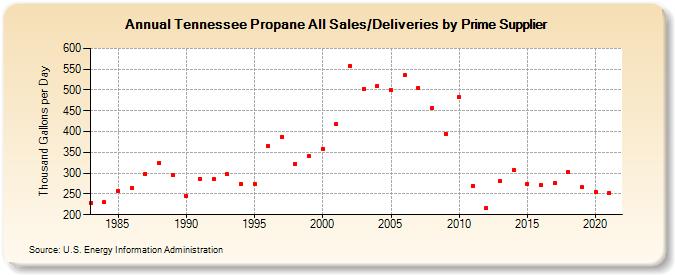
| Tennessee Propane All Sales/Deliveries by Prime Supplier (Thousand Gallons per Day) | ||||||||
| Decade | Year-0 | Year-1 | Year-2 | Year-3 | Year-4 | Year-5 | Year-6 | Year-7 | Year-8 | Year-9 |
|---|---|---|---|---|---|---|---|---|---|---|
| 1980's | 228.8 | 230.2 | 258.2 | 263.6 | 298.6 | 325.2 | 295.2 | |||
| 1990's | 244.9 | 287.0 | 286.2 | 297.6 | 273.9 | 274.5 | 365.3 | 387.6 | 322.3 | 342.2 |
| 2000's | 359.1 | 417.4 | 558.2 | 503.3 | 509.5 | 499.9 | 535.7 | 505.7 | 456.4 | 394.8 |
| 2010's | 483.6 | 269.7 | 216.4 | 280.5 | 308.3 | 274.2 | 271.2 | 275.8 | 303.1 | 265.9 |
| 2020's | 255.8 |
| - = No Data Reported; -- = Not Applicable; NA = Not Available; W = Withheld to avoid disclosure of individual company data. |
| Release Date: 6/1/2022 |
| Next Release Date: TBD |