|
Download Data (XLS File) |
|
||||||||
|
||||||||
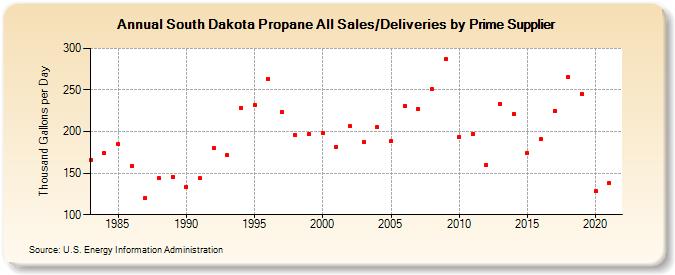
| South Dakota Propane All Sales/Deliveries by Prime Supplier (Thousand Gallons per Day) | ||||||||
| Decade | Year-0 | Year-1 | Year-2 | Year-3 | Year-4 | Year-5 | Year-6 | Year-7 | Year-8 | Year-9 |
|---|---|---|---|---|---|---|---|---|---|---|
| 1980's | 166.2 | 174.0 | 184.6 | 159.0 | 119.9 | 143.6 | 145.6 | |||
| 1990's | 133.5 | 144.0 | 179.9 | 171.6 | 228.4 | 231.7 | 263.7 | 223.9 | 195.9 | 196.5 |
| 2000's | 198.3 | 181.7 | 206.2 | 187.6 | 205.1 | 188.1 | 230.7 | 227.4 | 250.9 | 287.0 |
| 2010's | 193.7 | 197.0 | 159.7 | 233.5 | 221.6 | 174.2 | 191.0 | 225.3 | 265.8 | 245.5 |
| 2020's | 128.0 |
| - = No Data Reported; -- = Not Applicable; NA = Not Available; W = Withheld to avoid disclosure of individual company data. |
| Release Date: 6/1/2022 |
| Next Release Date: TBD |