|
Download Data (XLS File) |
|
||||||||
|
||||||||
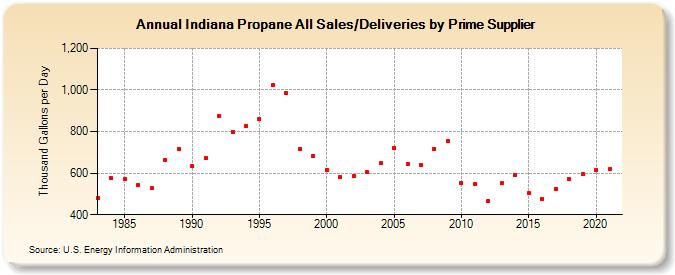
| Indiana Propane All Sales/Deliveries by Prime Supplier (Thousand Gallons per Day) | ||||||||
| Decade | Year-0 | Year-1 | Year-2 | Year-3 | Year-4 | Year-5 | Year-6 | Year-7 | Year-8 | Year-9 |
|---|---|---|---|---|---|---|---|---|---|---|
| 1980's | 479.3 | 576.4 | 569.6 | 540.8 | 526.7 | 664.2 | 716.1 | |||
| 1990's | 632.2 | 673.8 | 875.2 | 799.2 | 826.3 | 861.0 | 1,021.9 | 986.2 | 717.3 | 683.7 |
| 2000's | 616.4 | 580.7 | 588.4 | 604.2 | 647.2 | 719.8 | 643.7 | 640.2 | 717.8 | 756.1 |
| 2010's | 554.7 | 545.9 | 466.4 | 551.1 | 592.1 | 502.4 | 477.7 | 525.3 | 573.2 | 594.3 |
| 2020's | 613.3 |
| - = No Data Reported; -- = Not Applicable; NA = Not Available; W = Withheld to avoid disclosure of individual company data. |
| Release Date: 6/1/2022 |
| Next Release Date: TBD |