|
Download Data (XLS File) |
|
||||||||
|
||||||||
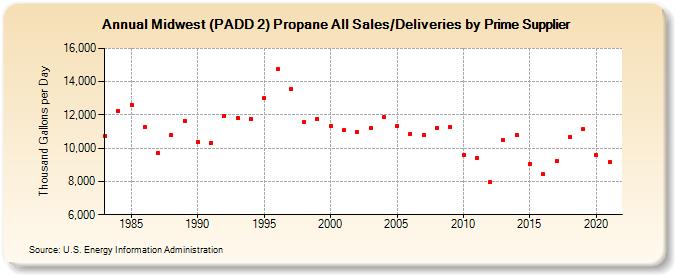
| Midwest (PADD 2) Propane All Sales/Deliveries by Prime Supplier (Thousand Gallons per Day) | ||||||||
| Decade | Year-0 | Year-1 | Year-2 | Year-3 | Year-4 | Year-5 | Year-6 | Year-7 | Year-8 | Year-9 |
|---|---|---|---|---|---|---|---|---|---|---|
| 1980's | 10,723.1 | 12,241.1 | 12,623.8 | 11,275.4 | 9,718.0 | 10,767.3 | 11,642.3 | |||
| 1990's | 10,365.2 | 10,341.7 | 11,962.9 | 11,788.1 | 11,764.1 | 13,024.5 | 14,731.3 | 13,557.5 | 11,596.0 | 11,766.8 |
| 2000's | 11,310.2 | 11,100.6 | 10,970.7 | 11,189.5 | 11,858.9 | 11,352.1 | 10,864.1 | 10,779.6 | 11,242.6 | 11,294.2 |
| 2010's | 9,574.9 | 9,396.2 | 7,955.4 | 10,485.3 | 10,821.2 | 9,053.8 | 8,425.0 | 9,224.8 | 10,661.0 | 11,132.9 |
| 2020's | 9,568.4 |
| - = No Data Reported; -- = Not Applicable; NA = Not Available; W = Withheld to avoid disclosure of individual company data. |
| Release Date: 6/1/2022 |
| Next Release Date: TBD |