|
Download Data (XLS File) |
|
||||||||
|
||||||||
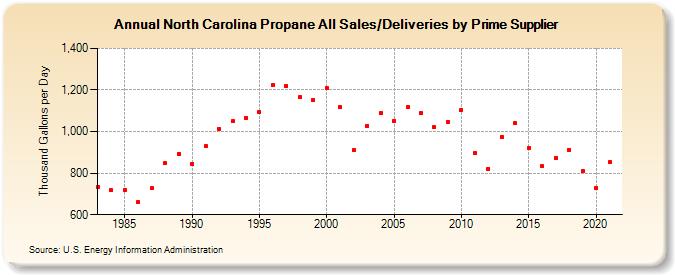
| North Carolina Propane All Sales/Deliveries by Prime Supplier (Thousand Gallons per Day) | ||||||||
| Decade | Year-0 | Year-1 | Year-2 | Year-3 | Year-4 | Year-5 | Year-6 | Year-7 | Year-8 | Year-9 |
|---|---|---|---|---|---|---|---|---|---|---|
| 1980's | 734.0 | 716.7 | 717.0 | 659.2 | 726.6 | 846.6 | 893.4 | |||
| 1990's | 845.7 | 928.5 | 1,014.0 | 1,048.9 | 1,067.5 | 1,093.4 | 1,223.1 | 1,220.0 | 1,164.2 | 1,150.9 |
| 2000's | 1,209.2 | 1,117.2 | 911.0 | 1,029.0 | 1,088.9 | 1,052.0 | 1,115.9 | 1,087.7 | 1,020.6 | 1,047.6 |
| 2010's | 1,105.1 | 895.6 | 821.1 | 975.6 | 1,040.9 | 920.6 | 832.5 | 873.6 | 913.3 | 808.3 |
| 2020's | 727.6 |
| - = No Data Reported; -- = Not Applicable; NA = Not Available; W = Withheld to avoid disclosure of individual company data. |
| Release Date: 6/1/2022 |
| Next Release Date: TBD |