|
Download Data (XLS File) |
|
||||||||
|
||||||||
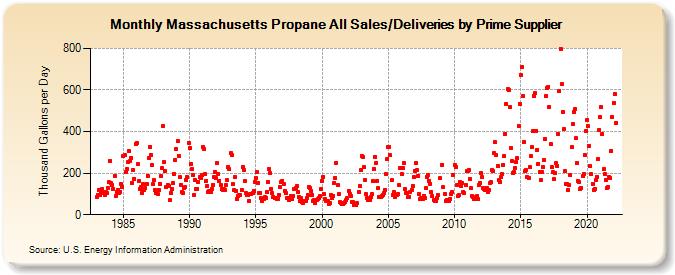
| Massachusetts Propane All Sales/Deliveries by Prime Supplier (Thousand Gallons per Day) | ||||||||
| Year | Jan | Feb | Mar | Apr | May | Jun | Jul | Aug | Sep | Oct | Nov | Dec |
|---|---|---|---|---|---|---|---|---|---|---|---|---|
| 1983 | 84.7 | 96.8 | 116.5 | 94.2 | 109.2 | 123.0 | 104.3 | 96.1 | 111.5 | 102.4 | 130.1 | 155.0 |
| 1984 | 259.7 | 150.6 | 142.9 | 125.7 | 186.3 | 90.2 | 110.7 | 120.3 | 103.9 | 111.2 | 148.4 | 132.9 |
| 1985 | 284.8 | 287.1 | 205.0 | 218.2 | 251.5 | 305.8 | 256.2 | 274.1 | 153.9 | 215.5 | 173.9 | 339.4 |
| 1986 | 345.2 | 241.8 | 160.8 | 125.5 | 134.0 | 106.5 | 146.9 | 120.6 | 128.1 | 149.1 | 187.9 | 273.4 |
| 1987 | 327.7 | 287.2 | 239.7 | 146.3 | 165.0 | 118.5 | 102.3 | 101.0 | 119.4 | 149.2 | 185.7 | 223.0 |
| 1988 | 424.8 | 252.3 | 207.9 | 134.4 | 144.0 | 137.2 | 69.1 | 105.0 | 122.7 | 151.1 | 197.5 | 264.8 |
| 1989 | 315.0 | 353.6 | 283.9 | 179.4 | 144.3 | 110.3 | 102.8 | 127.4 | 132.3 | 167.1 | 180.5 | 347.2 |
| 1990 | 320.4 | 244.7 | 221.2 | 190.5 | 95.1 | 166.0 | 123.6 | 125.3 | 158.2 | 182.8 | 174.3 | 191.0 |
| 1991 | 327.5 | 317.5 | 196.6 | 163.8 | 139.3 | 108.1 | 112.2 | 107.7 | 124.9 | 143.0 | 182.6 | 207.4 |
| 1992 | 174.5 | 247.4 | 196.9 | 163.4 | 143.0 | 121.3 | 121.2 | 121.3 | 118.6 | 143.6 | 164.8 | 228.8 |
| 1993 | 218.9 | 294.9 | 288.6 | 147.7 | 117.4 | 180.8 | 116.0 | 74.6 | 90.9 | 93.5 | 94.3 | 120.1 |
| 1994 | 231.6 | 214.0 | 161.4 | 104.9 | 97.1 | 94.7 | 66.8 | 98.8 | 100.5 | 106.2 | 113.6 | 159.4 |
| 1995 | 175.4 | 203.6 | 152.4 | 105.1 | 104.6 | 78.6 | 65.2 | 74.7 | 83.9 | 82.4 | 107.1 | 158.0 |
| 1996 | 218.9 | 199.0 | 123.8 | 102.4 | 85.6 | 80.3 | 80.2 | 77.3 | 77.4 | 96.4 | 132.3 | 155.5 |
| 1997 | 162.5 | 145.5 | 116.3 | 103.7 | 80.7 | 80.6 | 72.4 | 74.9 | 90.2 | 76.3 | 90.1 | 122.4 |
| 1998 | 127.4 | 136.2 | 111.5 | 86.1 | 64.0 | 81.4 | 59.8 | 58.2 | 65.6 | 68.3 | 79.7 | 92.5 |
| 1999 | 135.5 | 126.4 | 115.7 | 93.3 | 68.0 | 70.6 | 54.0 | 71.8 | 74.1 | 79.8 | 89.8 | 124.4 |
| 2000 | 161.5 | 180.4 | 98.0 | 74.9 | 67.3 | 65.4 | 52.5 | 57.5 | 97.0 | 80.2 | 91.5 | 154.0 |
| 2001 | 176.6 | 249.9 | 143.1 | 98.0 | 60.7 | 58.2 | 52.7 | 49.8 | 57.1 | 61.0 | 72.6 | 78.4 |
| 2002 | 115.1 | 100.2 | 89.5 | 61.9 | 59.7 | 45.2 | 45.3 | 45.6 | 55.1 | 109.6 | 137.5 | 212.8 |
| 2003 | 282.5 | 278.4 | 227.1 | 167.7 | 99.1 | 80.1 | 69.0 | 72.5 | 87.0 | 99.1 | 159.8 | 221.5 |
| 2004 | 278.3 | 249.6 | 163.3 | 126.2 | 83.9 | 86.7 | 90.6 | 96.9 | 103.7 | 118.6 | 194.1 | 267.4 |
| 2005 | 325.3 | 325.7 | 286.0 | 165.2 | 94.9 | 107.3 | 83.5 | 93.8 | 94.7 | 100.6 | 141.6 | 222.6 |
| 2006 | 195.6 | 224.0 | 248.6 | 124.5 | 105.6 | 105.0 | 84.8 | 86.9 | 110.0 | 121.1 | 139.3 | 181.3 |
| 2007 | 211.1 | 246.8 | 213.5 | 186.6 | 100.3 | 74.8 | 80.9 | 75.2 | 91.9 | 78.2 | 127.8 | 181.9 |
| 2008 | 191.8 | 164.1 | 149.8 | 109.6 | 87.8 | 68.8 | 67.4 | 64.5 | 79.7 | 96.3 | W | 175.9 |
| 2009 | W | 240.8 | 131.5 | 100.1 | 67.7 | 72.7 | 72.1 | 64.4 | 77.0 | 101.6 | 107.2 | 190.5 |
| 2010 | 237.6 | 229.2 | 143.1 | 91.5 | 93.0 | 158.0 | 138.4 | 154.1 | 109.5 | 104.0 | 144.0 | 209.2 |
| 2011 | 209.1 | 215.8 | 171.2 | 126.8 | 90.3 | 85.4 | 76.6 | 74.2 | 87.9 | 76.6 | 142.7 | 154.0 |
| 2012 | 199.4 | 180.6 | 129.8 | 123.5 | 119.1 | 130.6 | 109.7 | 120.0 | 150.6 | 155.7 | 213.6 | 210.2 |
| 2013 | 295.6 | 347.4 | 285.8 | 233.4 | 166.4 | 158.0 | 179.8 | 194.0 | 241.1 | 282.3 | 389.2 | 533.6 |
| 2014 | 605.5 | 599.7 | 516.0 | 320.8 | 257.1 | 201.7 | 205.7 | 226.5 | 254.3 | 271.1 | 426.1 | 534.5 |
| 2015 | 670.8 | 708.2 | 570.4 | 348.9 | 208.1 | 214.3 | 180.9 | 176.0 | 227.3 | 281.0 | 325.5 | 402.4 |
| 2016 | 569.6 | 583.6 | 403.4 | 312.6 | 246.2 | 206.4 | 168.9 | 205.7 | 228.5 | 261.5 | 365.5 | 572.7 |
| 2017 | 608.5 | 615.7 | 518.3 | 338.9 | 227.7 | 204.1 | 171.1 | 198.7 | 246.9 | 235.5 | 387.5 | 595.4 |
| 2018 | 799.4 | 627.3 | 495.2 | 409.9 | 208.5 | 147.8 | 149.6 | 121.2 | 142.9 | 191.7 | 323.6 | 436.3 |
| 2019 | 494.2 | 506.6 | 367.8 | 247.9 | 161.4 | 156.8 | 124.9 | 130.6 | 184.7 | 197.5 | 288.0 | 403.3 |
| 2020 | 456.5 | 424.6 | 332.5 | 232.4 | 193.7 | 149.1 | 121.0 | 125.5 | 168.7 | 183.6 | 267.6 | 408.3 |
| 2021 | 468.5 | 516.5 | 388.0 | 219.8 | 196.5 | 167.7 | 128.4 | 133.5 | 182.5 | 177.3 | 307.9 | 470.6 |
| 2022 | 538.9 | 581.7 | 438.8 | |||||||||
| - = No Data Reported; -- = Not Applicable; NA = Not Available; W = Withheld to avoid disclosure of individual company data. |
| Release Date: 5/19/2022 |
| Next Release Date: TBD |