|
Download Data (XLS File) |
|
||||||||
|
||||||||
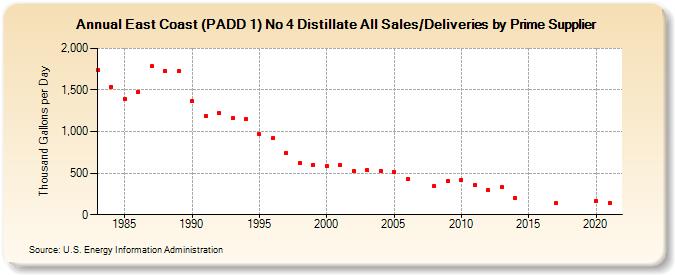
| East Coast (PADD 1) No 4 Distillate All Sales/Deliveries by Prime Supplier (Thousand Gallons per Day) | ||||||||
| Decade | Year-0 | Year-1 | Year-2 | Year-3 | Year-4 | Year-5 | Year-6 | Year-7 | Year-8 | Year-9 |
|---|---|---|---|---|---|---|---|---|---|---|
| 1980's | 1,738.4 | 1,538.3 | 1,390.0 | 1,476.0 | 1,784.9 | 1,734.1 | 1,724.4 | |||
| 1990's | 1,366.1 | 1,188.3 | 1,218.8 | 1,162.4 | 1,150.9 | 969.0 | 921.4 | 743.3 | 622.3 | 600.7 |
| 2000's | 587.7 | 596.8 | 524.8 | 536.6 | 526.0 | 509.6 | 423.5 | W | 340.5 | 402.3 |
| 2010's | 415.7 | 354.1 | 294.8 | 330.5 | 203.7 | W | W | 135.2 | W | W |
| 2020's | 161.9 |
| - = No Data Reported; -- = Not Applicable; NA = Not Available; W = Withheld to avoid disclosure of individual company data. |
| Release Date: 6/1/2022 |
| Next Release Date: TBD |