|
Download Data (XLS File) |
|
||||||||
|
||||||||
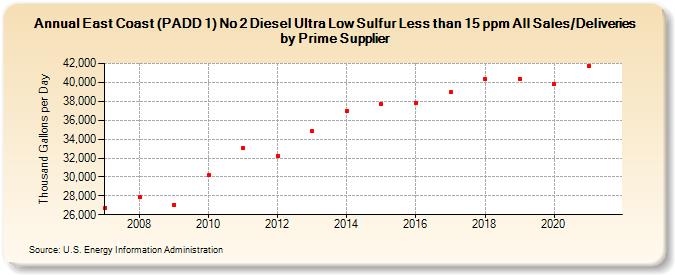
| East Coast (PADD 1) No 2 Diesel Ultra Low Sulfur Less than 15 ppm All Sales/Deliveries by Prime Supplier (Thousand Gallons per Day) | ||||||||
| Decade | Year-0 | Year-1 | Year-2 | Year-3 | Year-4 | Year-5 | Year-6 | Year-7 | Year-8 | Year-9 |
|---|---|---|---|---|---|---|---|---|---|---|
| 2000's | 26,731.0 | 27,873.5 | 27,055.4 | |||||||
| 2010's | 30,168.8 | 33,048.2 | 32,240.5 | 34,827.3 | 36,985.0 | 37,704.2 | 37,868.4 | 38,953.9 | 40,309.9 | 40,387.3 |
| 2020's | 39,813.6 |
| - = No Data Reported; -- = Not Applicable; NA = Not Available; W = Withheld to avoid disclosure of individual company data. |
| Release Date: 6/1/2022 |
| Next Release Date: TBD |